I think you should be using multiple plots involving facet_*. Try and organize your thoughts around what data you are trying to present in each collection of plots, and keep in mind that sometimes it's better to write longer, more boring, and more explicit code.
Here's how I would do what you described:
library(dplyr)
library(ggplot2)
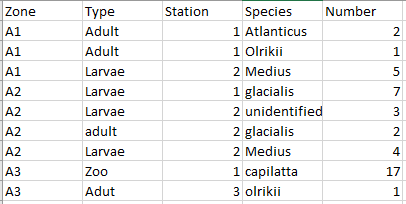
df <- tribble(
~zone, ~type, ~station, ~species, ~number,
'A1', 'Adult', 1, 'Atlanticus', 2,
'A1', 'Adult', 1, 'Olrikii', 1,
'A1', 'Larvae', 2, 'Medius', 5,
'A2', 'Larvae', 1, 'Glacialis', 7,
'A2', 'Larvae', 2, 'Unidentified', 3,
'A2', 'Adult', 2, 'Glacialis', 2,
'A2', 'Larvae', 2, 'Medius', 4,
'A3', 'Zoo', 1, 'Capilatta', 17,
'A3', 'Adult', 3, 'Olrikii', 1
)
# Proportion of types per station
df %>%
group_by(zone, type) %>%
summarize(
zone_type_sum = sum(number),
.groups = 'drop_last' # You can skip this, it is the default behavior, but it helps make your code more transparent in what it is doing
) %>%
mutate(
zone_sum = sum(zone_type_sum),
proportion = zone_type_sum / zone_sum
) %>%
ggplot(aes(x = type, y = proportion)) +
geom_col() +
facet_wrap(~zone)
# Distribution of Species for adults
df %>%
filter(type == 'Adult') %>%
group_by(zone, species) %>%
summarize(
num_per_species = sum(number)
) %>%
mutate(
num_per_zone = sum(num_per_species),
proportion = num_per_species / num_per_zone
) %>%
ggplot(aes(x = species, y = proportion)) +
geom_col(aes(fill = species)) +
facet_wrap(~zone)
# And you can follow a similar approach as needed
There are certainly ways to write more concise code than the above, but I think the above forces you to think about your analysis more in a more cogent way, i.e. each time you want to do something, you have to explicitly specify the following:
- What is my dataset?
- What relationship am I trying to communicate?
- What steps do I need to take to transform the dataset to include those relationships, if they are not there already?
- How do I plot my data?