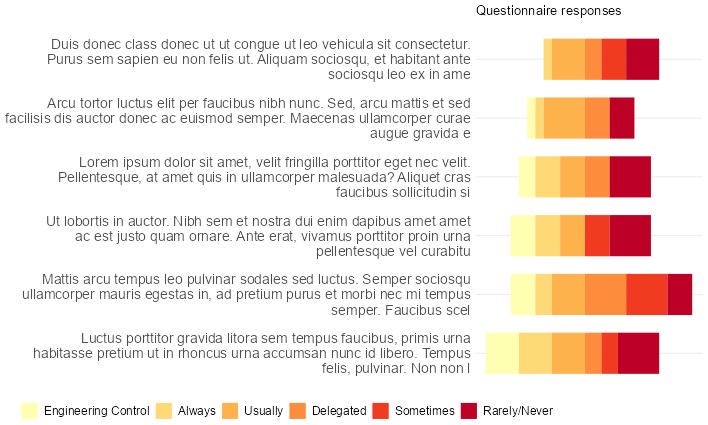
I'm struggling to get my ggplot to put the legend where I want it. My plot has a lot of text in the y-margin. It seems I can't tell ggplot to use that left space.
Fully reproducable example below. Here is the plot I am getting:
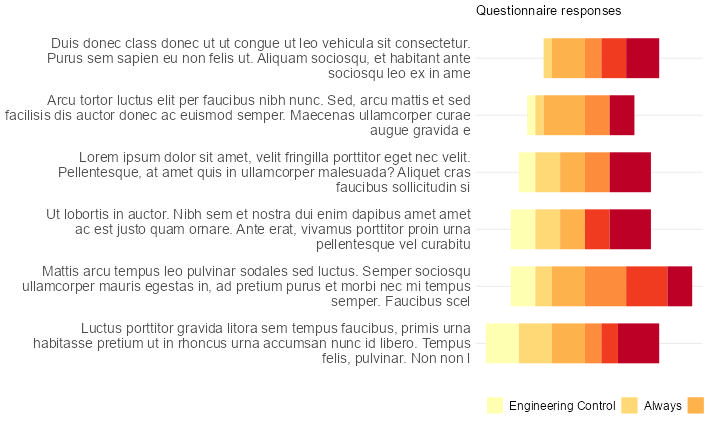
Obviously what I want is more like this:
I can obviously get my crayons out and edit it in. I suspect there may be a way with grobs (its been a long time since I've had to resort to that), but I'm hoping someone can explain some tiny setting that fixes it for me!
## Reproducable example
require(ggplot2)
require(stringi)
require(RColorBrewer)

## Possible answers to questions, in order
order <- c("Engineering Control",
           "Always",
           "Usually",
           "Delegated",
           "Sometimes",
           "Rarely/Never")

## Create some dummy questions
set.seed(45)
questions <- stri_rand_lipsum(6, start_lipsum = TRUE)
# Cut the dummy questions down a bit
questions <- questions |>
  stri_sub(from= 1, to = 160)

## Build a dataset with extremely long category labels
myData <- tibble(
  questions = sort(rep(questions,6)),
  answer = rep(order,6),
  frequency = round(runif(36, 0,5))
)

# Show the first 6 lines of data to make sure we know what we are dealing with
head(myData)

# Reorder the data so that the 'best' responses are sorted
myDataGood <- myData |>
  group_by(questions) |>
  filter (answer %in% c("Engineering Control",
                       "Always",
                       "Usually" )) |>
  summarise(sum(frequency))

myData |>
  # Set the order the bars will appear using factors
  mutate(answer = as.factor(answer)) |>
  mutate(answer = forcats::fct_relevel(answer, order))|>
  # use the good data to sort the questions
  left_join(myDataGood) |>
  arrange(-`sum(frequency)`, questions ) |>
  mutate(questions = factor(questions)) -> myData

# Get the question order for the x-axis
Qorder <-  as.character(unique(myData$questions))

# Create a colour pallette
colours <- RColorBrewer::brewer.pal(6, "YlOrRd")

## Build a plot
ggplot(data = myData, aes(x = questions, fill = answer)) +
  # Plot "good" answers to the left
  geom_bar(data = subset(myData, answer %in% c("Engineering Control", "Always", "Usually")),
           aes(y = -frequency ),
           position="stack",
           stat="identity", width = 0.7) +
  # Plot poorer answers to the right of a centre line
  geom_bar(data = subset(myData, ! answer %in% c("Engineering Control", "Always", "Usually")),
           aes(y = frequency ),
           position=position_stack(reverse = T),
           stat="identity", width = 0.7) +
  # Make the plot run left to right
  coord_flip() +
  # Wrap the text at 72 characters, and order the x axis [axes are flipped so is y! on the output]
  scale_x_discrete(labels = function(x) str_wrap(x, width = 72), limits = Qorder) +
  # Add the colours in the correct order
  scale_fill_manual(name = NULL, breaks = order , values = colours) +
  # minimise screen trash
  theme_minimal() +
  labs(title = "Questionnaire responses")  +
  # remove unwanted labels
  xlab(NULL) + ylab (NULL) +
  theme(
    # Move the legend to the bottom
    legend.direction = "horizontal", legend.position =  "bottom",
    # Set the legend text size
    legend.text = element_text(size = 12),
    # Try to make the legend align left   << doesnt seem to make any difference
    legend.justification = "left",
    # Remove unwanted gridlines
    panel.grid.major.x = element_blank(),
    panel.grid.minor = element_blank(),
    axis.text.x=element_blank(),
    axis.ticks.x=element_blank(),
    # Set the question text size
    axis.text.y=element_text(size = 14)) +
  # Set the legend to be on a single line
  guides(fill = guide_legend(nrow = 1)) -> gg_example

ggsave("example.jpg", gg_example, width = 25, height = 15, units = c("cm"), dpi = 72)
Sample of what the data looks like but I dont think this is a data problem
>  head(myData)
> # A tibble: 6 × 4
>  questions                                                                      answer frequency `sum(frequency)`
> <fct>                                                                           <fct>      <dbl>            <dbl>
> 1 Luctus porttitor gravida litora sem tempus faucibus, primis urna habitasse u… Engin…         4               12
> 2 Luctus porttitor gravida litora sem tempus faucibus, primis urna habitasse u… Always         4               12
> 3 Luctus porttitor gravida litora sem tempus faucibus, primis urna habitasse u… Usual…         4               12
> 4 Luctus porttitor gravida litora sem tempus faucibus, primis urna habitasse u… Deleg…         2               12
> 5 Luctus porttitor gravida litora sem tempus faucibus, primis urna habitasse u… Somet…         2               12
> 6 Luctus porttitor gravida litora sem tempus faucibus, primis urna habitasse u… Rarel…         5               12