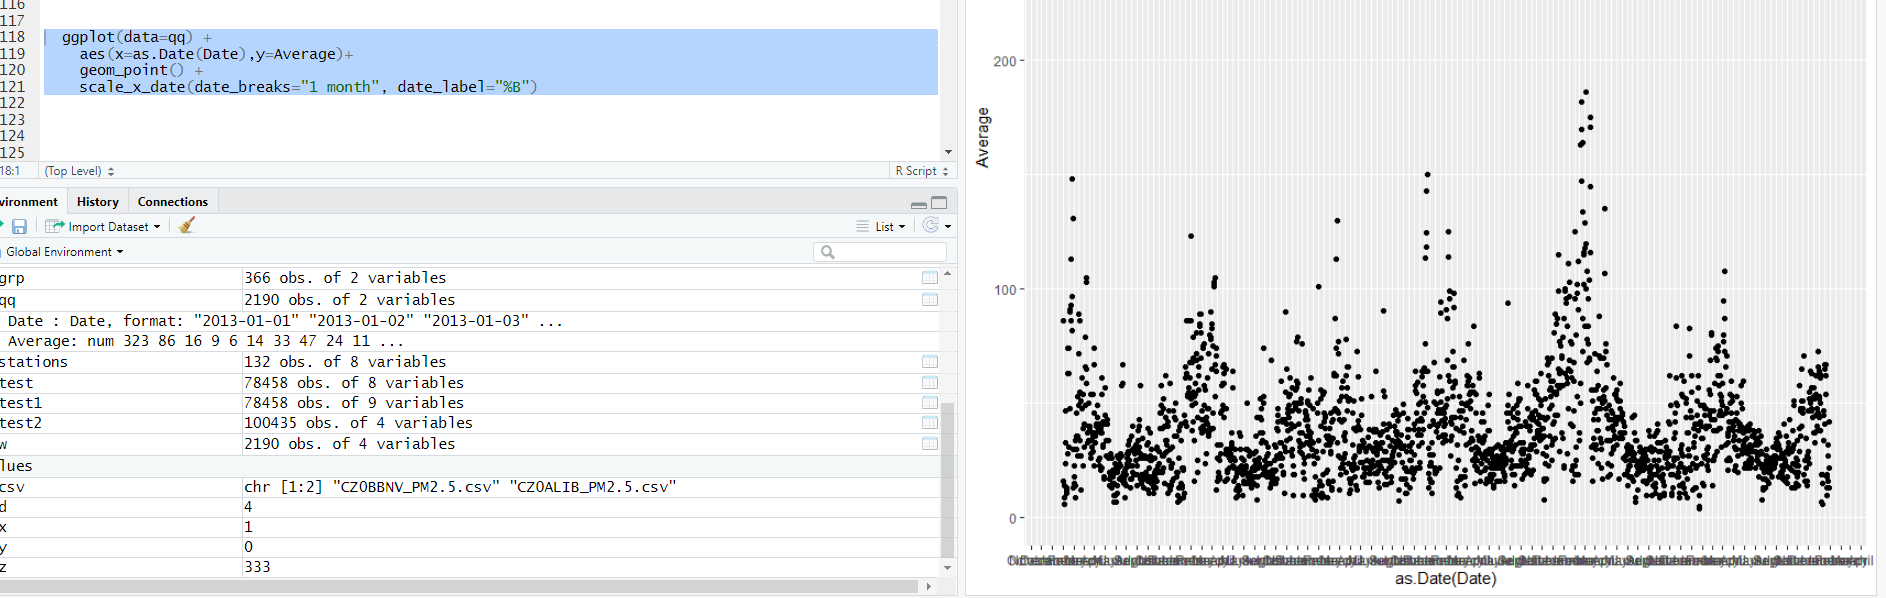
Hey Guys, I am hoping I could get some help with this minor problem I am facing.
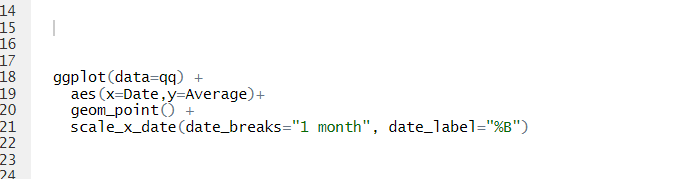
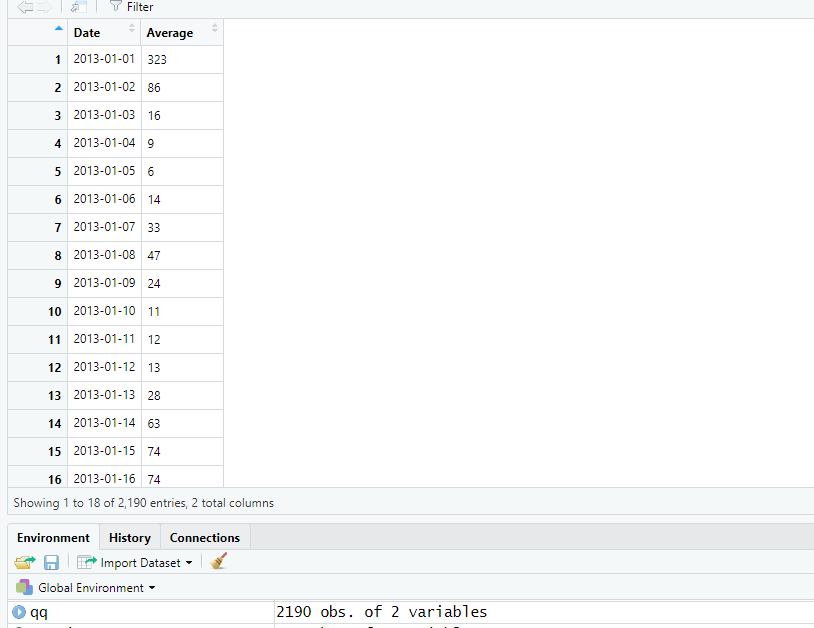
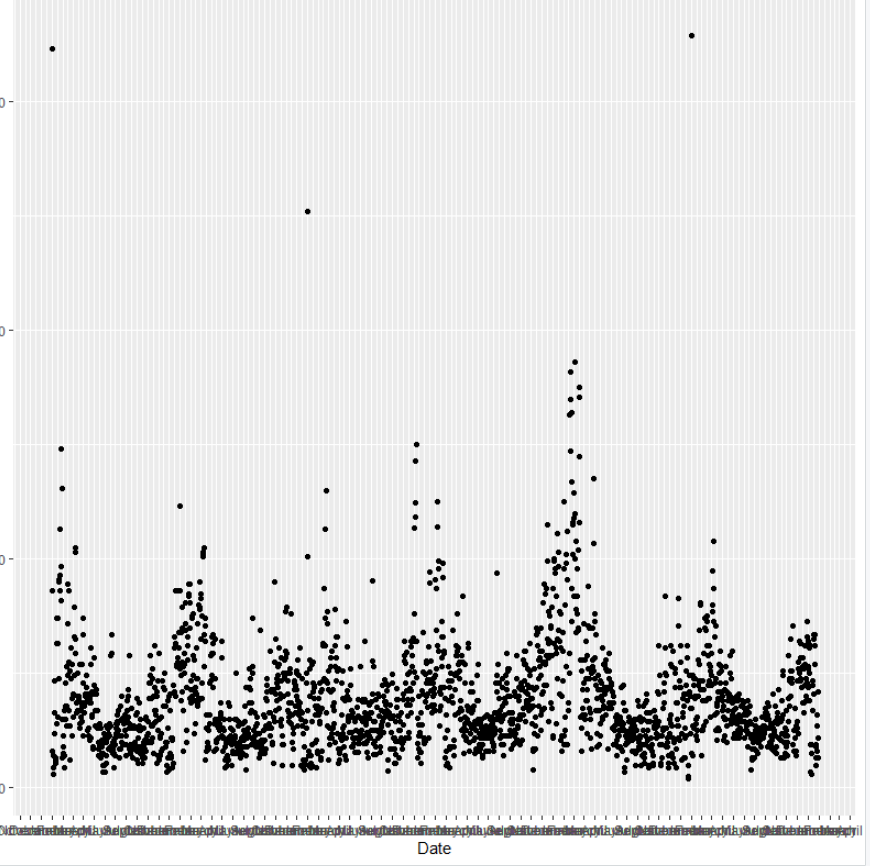
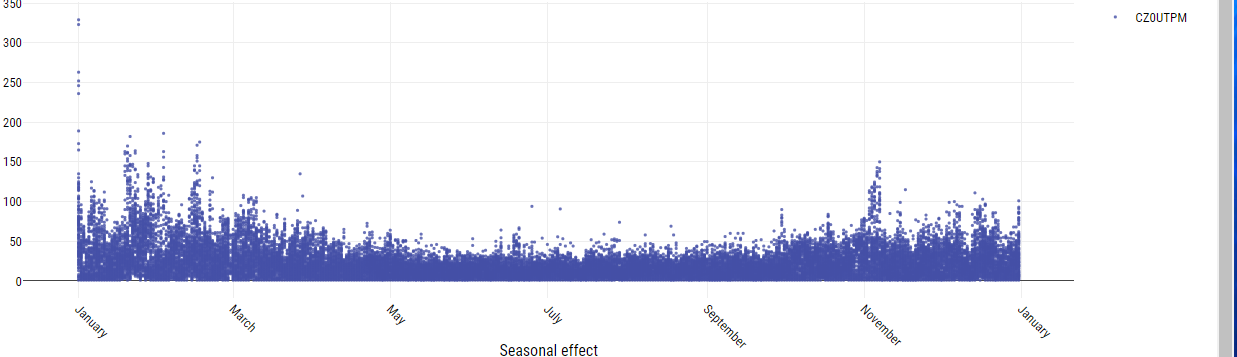
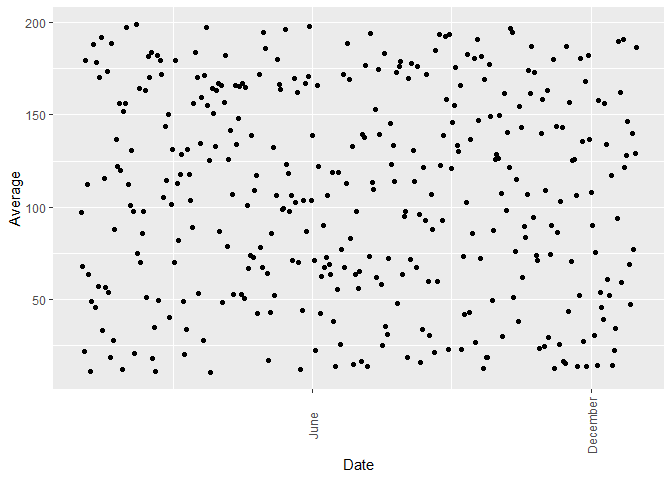
I have a data frame called qq and it has two columns Date and Average. What I am trying to do is plot "Months" on the x-axis (going from Jan 1st to Dec 31st ) and on the y-axis "Average". I have been doing research and they recommend scale_x_date with date_label option set to %B. But for some reason, it's not working. As you can see it's like it's covered up and you cant see the months so really not sure what to do next. Any help appreciated. Thanks. N.B There is a picture of how it should really look the blue scatter plot diagram.
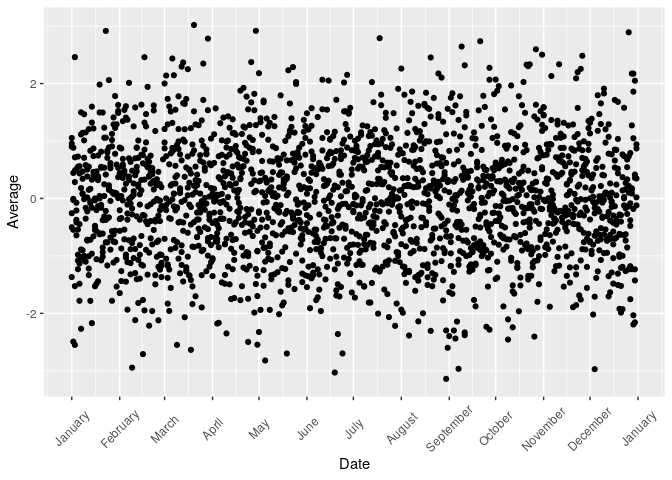
Maybe you have too many individual months so that the labels are overlapping try setting date_breaks = "6 month" and rotating the labels with the theme function as I did in the code below.
DF <- data.frame(Date = seq.Date(from = as.Date("2020-01-01"),
                                 to = as.Date("2020-12-31"), by = "day"),
                 Average = runif(n = 366, min = 10, max = 200))

library(ggplot2)
ggplot(DF, aes(Date, Average)) + geom_point() +
  scale_x_date(date_breaks = "6 month", date_labels = "%B") +
  theme(axis.text.x = element_text(angle = 90, hjust = 0.5, vjust = 0.5))
From the reference plot you are showing it seems to me you are trying to aggregate by the day of the year (no matter what year), if that is the case then you can do something like this.