Dear Community,
Sorry to bother you again but I have a question relating to the legend for GGPLOT. I created a simple example to illustrate my question:
code in R
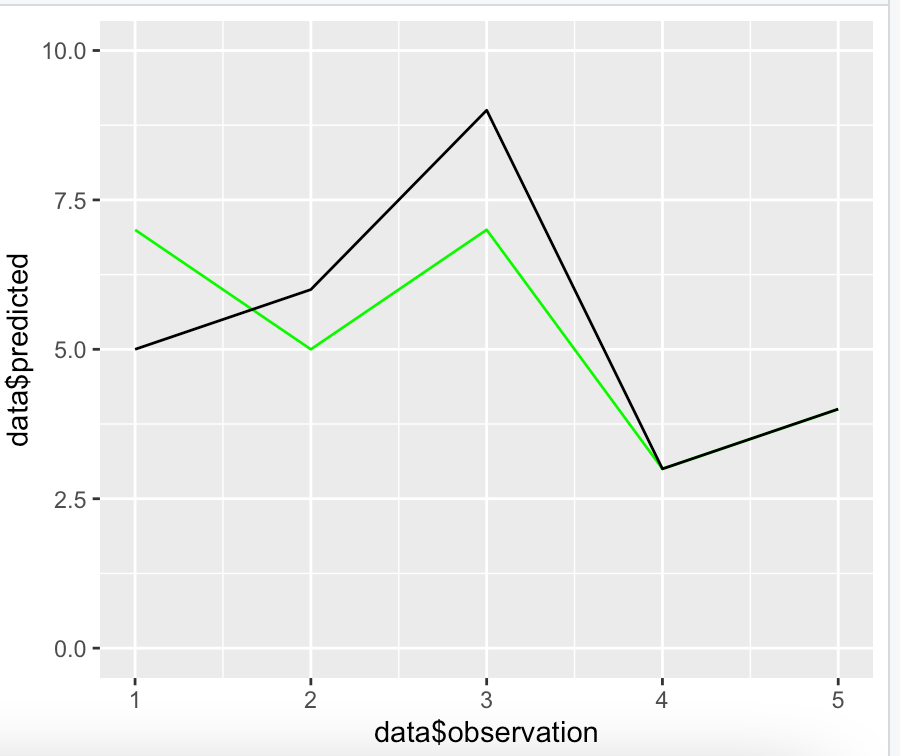
data <- data.frame(observation = c(1:5), actual = c(5,6,9,3,4), predicted = c(7,5,7,3,4))
plot <- ggplot(data = data, aes(x=data$observation, y=data$predicted)) +
geom_line(color = "green") +
geom_line(y = data$actual) +
ylim(0,10)
I would like to add in a legend saying:
green = predicted
black = actual
I saw a lot of examples with factors but is it also possible to add a legend for these lines?
Thank you in advance!
With kind regards,
DataMagic
Leon
2
See if this does the trick:
# Load libraries ----------------------------------------------------------
library("tidyverse")


# Define example data -----------------------------------------------------
my_data <- tibble(
  observation = seq(from = 1, to = 5),
  actual = c(5, 6, 9, 3, 4),
  predicted = c(7, 5, 7, 3, 4))


# Wrangle data ------------------------------------------------------------
my_data_long <- my_data %>%
  pivot_longer(cols = -observation,
               names_to = "measure",
               values_to = "value")


# Visualise data ----------------------------------------------------------
my_data_long %>%
  ggplot(aes(x = observation,
             y = value,
             colour = measure)) +
  geom_line() +
  scale_color_manual(values = c("black", "green")) +
  theme_minimal()
Hope it helps 
2 Likes
Thank you so much!! The predicted and actual values are now factors. It totally works! I will try this on my dataset! thank you
Leon
4
You are welcome, please remember to mark the solution, so that others may benefit
system
Closed
5
This topic was automatically closed 21 days after the last reply. New replies are no longer allowed.
If you have a query related to it or one of the replies, start a new topic and refer back with a link.