rama27
August 20, 2020, 3:00pm
1
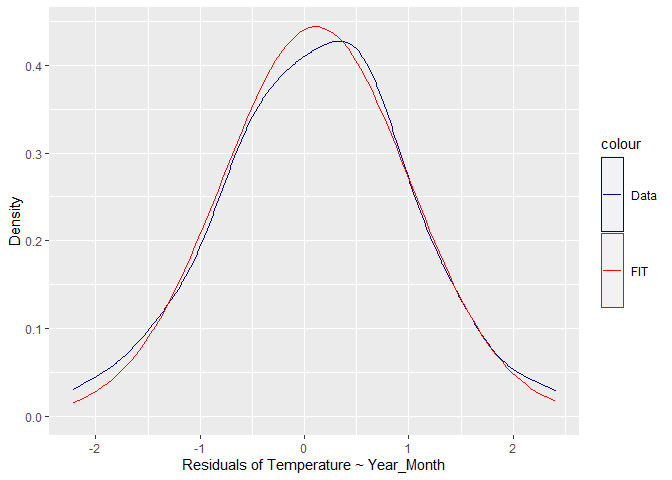
Hi, I have a following problem. I plot two lines using ggplot package - density plot and standard curve. See my code bellow:
ggplot(as.data.frame(resid(RegreseT)), aes(x=resid(RegreseT) )) +
  geom_density(alpha=.2 , color = "darkblue") +
  stat_function(fun = dnorm, args = list(mean = mean(resid(RegreseT)), sd = sd(resid(RegreseT))) , colour = "red") +
  xlab("Residuals of Temperature ~ Year_Month")+ylab("Density") +
  labs(colour="I need a legend!!!!") +
  theme(legend.key.height=unit(2, "cm"))
However, there is no legend in the output. Why, please? Thanks a lot.
FJCC
August 20, 2020, 3:30pm
2
To get a legend, the color should be set via the aes() function passed to the mapping argument of a geom. Here is an example of manually setting the colors using data that I think are similar to what you have.
library(ggplot2)
set.seed(1)
DF <- data.frame(Resid = rnorm(100))
COLORS <- c("Data" = "darkblue", "FIT" = "red")
ggplot(DF, aes(x= Resid)) +
  geom_density(alpha=.2 , mapping = aes(color = "Data")) +
  stat_function(fun = dnorm,
                args = list(mean = mean(DF$Resid), sd = sd(DF$Resid)),
                mapping = aes(color = "FIT")) +
  xlab("Residuals of Temperature ~ Year_Month")+ylab("Density") +
  #labs(colour="I need a legend!!!!") +
  scale_color_manual(values = COLORS) +
  theme(legend.key.height=unit(2, "cm"))
Created on 2020-08-20 by the reprex package (v0.3.0)
1 Like
system
August 27, 2020, 3:30pm
3
This topic was automatically closed 7 days after the last reply. New replies are no longer allowed.