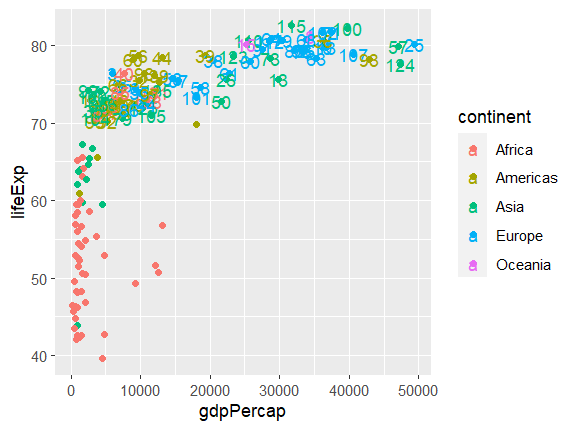
If you take a look at the column country, you'll see it is a Factor. When you use the "ifelse", it reduces the column to just the "levels". You could either wrap that in as.character, or use dplyr's "if_else" (which will do it as you expect). Here's both options:
gapminder %>%
filter(year == 2007) |>
mutate(label = if_else(lifeExp > limit_value,
as.character(country), "")) |> # set to character
ggplot(aes(x = gdpPercap, y = lifeExp,
color = continent))+
geom_point() +
geom_text(aes(label = label))
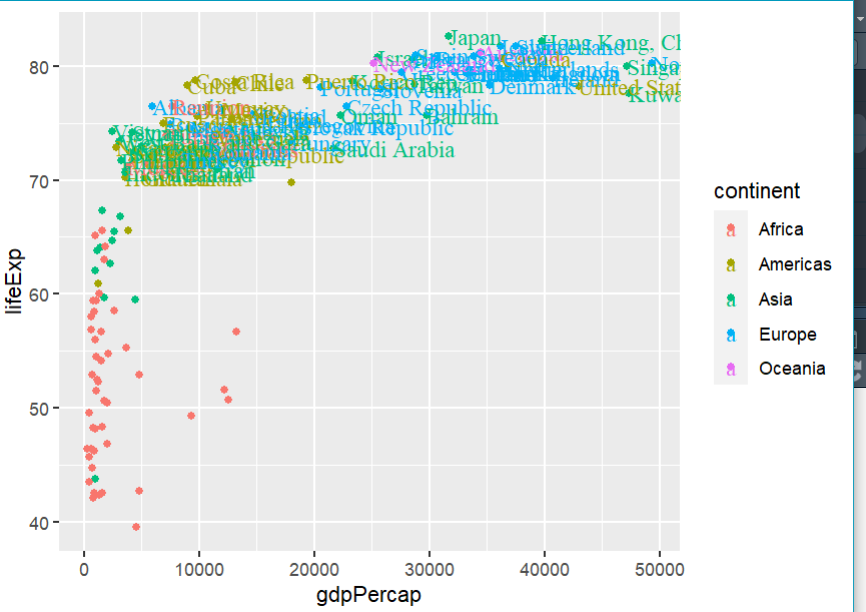
# or:
gapminder %>%
filter(year == 2007) |>
mutate(label = if_else(lifeExp > limit_value, #dplyr's if_else
country, "")) |>
ggplot(aes(x = gdpPercap, y = lifeExp,
color = continent))+
geom_point() +
geom_text(aes(label = label))