First time posting, hope it's not an obvious thing!
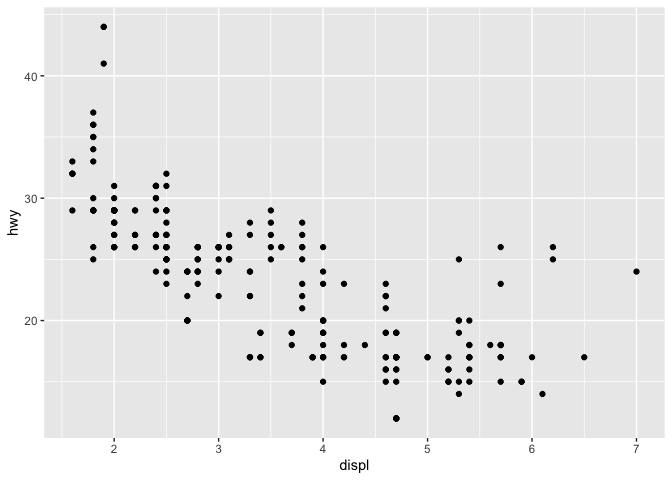
I installed R and Rstudio on a new machine (Mac), and ggplot2 no longer prints the axis labels. I have reinstalled R, R-studio, and tidyverse (and ggplot2 independently). I checked to see if it's my code, even if I use the mpg dataset ggplot(data = mpg) + geom_point(mapping = aes(x = displ, y = hwy)) it generates a plot with no text or numbers. If I run the same directly in R, it works just fine.
Created on 2020-08-24 by the reprex package (v0.3.0.9001)
If it's working in R, but something's not working in the IDE, then it's probably an issue with your graphics device of some sort, and not ggplot itself. I'm going to move this to the RStudio IDE category. If you could give info re. the version of the IDE you're running, that'd probably help whoever knows enough to dig into this with you (unfortunately, not me).