Hi,
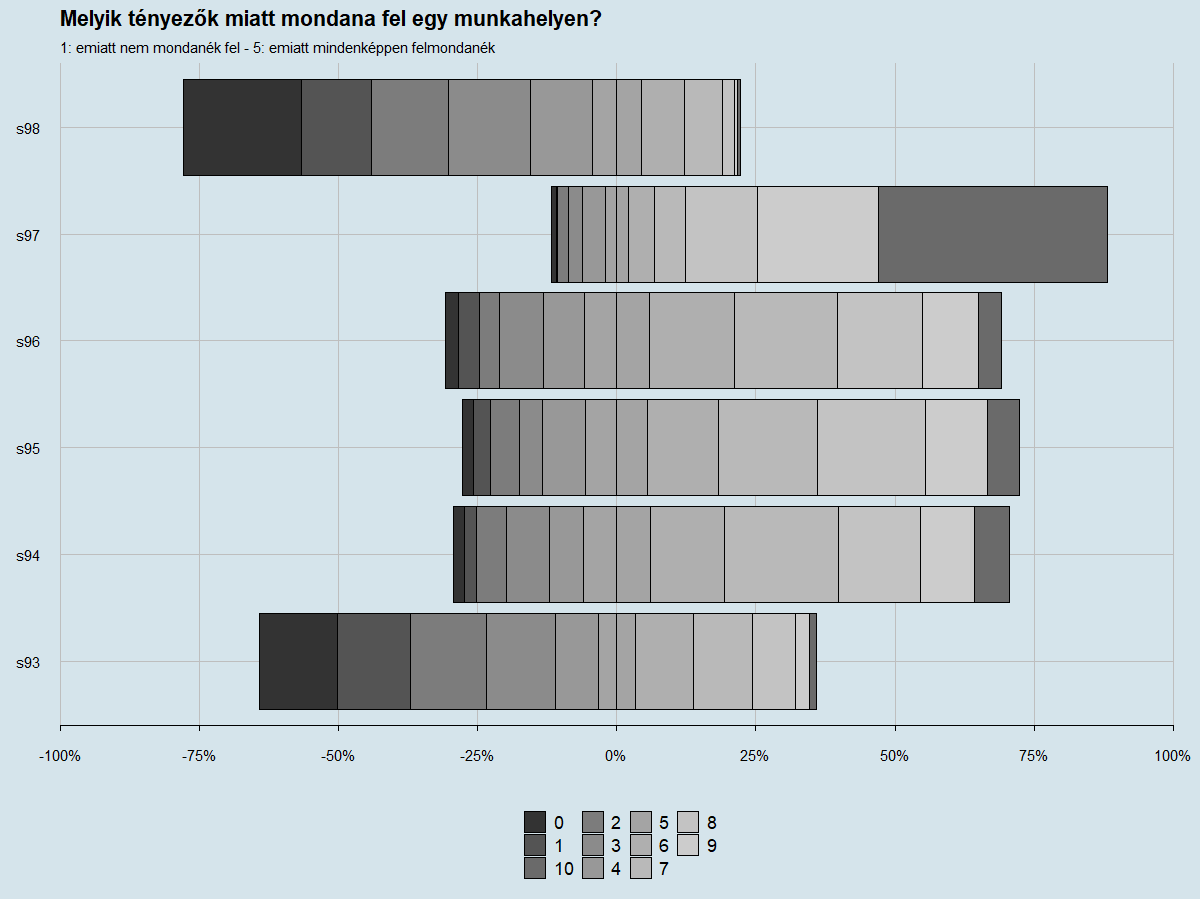
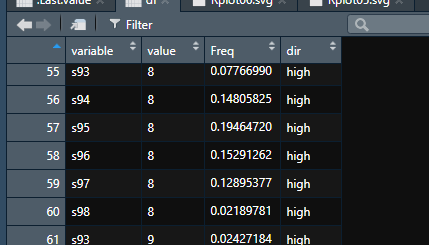
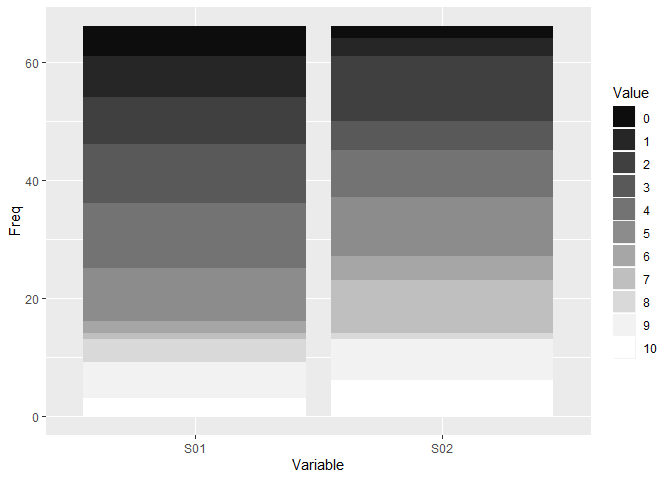
My issue is that I tried to plot a barchart with stat identity for lickert-scale values but from 0 to 10. my problem is that the place of the 10th block is fine, but the color palette starts form the beginnig. Enclosed some pics and a part of code.
The goal is to solve how to make the color of 10 to white.
Thank you for your help in advance.
ggplot() +
geom_bar(data = df %>% filter(dir=="low"), aes(x = variable, y = -Freq, fill = value), position = "stack", stat = "identity", color = "black") +
geom_bar(data = df %>% filter(dir=="high"), aes(x = variable, y = Freq, fill = value), stat = "identity", position = position_stack(reverse = TRUE), color = "black") +
scale_fill_grey() +
coord_flip() +
xlab("") +
ylab("") +
labs(
title = "Melyik tényezők miatt mondana fel egy munkahelyen?",
subtitle = "1: emiatt nem mondanék fel - 5: emiatt mindenképpen felmondanék"
) +
scale_y_continuous(labels = scales::percent_format(accuracy = 1), expand = c(0, 0), breaks = seq(-1, 1, 0.25), limits = c(-1, 1)) +
scale_x_discrete(labels = c(
"s43" = "A munkámat nem ismerik el", "s44" = "A béremelés kicsiny\nmértéke, elmaradása", "s45" = "Előrejutás nem szakmai\nszempontok alapján történik", "s46" = "Sok túlóra", "s47" = "Túlórák ki nem fizetése", "s48" = "Szakmailag nem\nmegfelelő környezet",
"s49" = "Monoton munka", "s50" = "20%-kal magasabb\nbérajánlat máshonnan"
)) +
theme_economist() +
theme(
legend.position = "bottom",
legend.title = element_blank(),
panel.grid.major = element_line(
colour = "grey",
size = rel(1)
),
panel.grid.major.x = element_line(
colour = "grey",
size = rel(1)
),
axis.title = element_text(margin = margin(t = 10, r = 1, b = 0, l = 0)),
plot.title = element_text(margin = margin(r = 10, b = 10, l = 0)),
axis.ticks.length = unit(5, "points"),
plot.margin = margin(r = 20, t = 5, b = 10)
)