Welcome Darya!
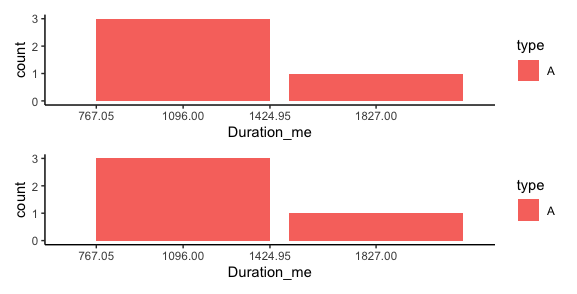
The help for the width argument of geom_bar says "By default, set to 90% of the resolution of the data." Since type is mapped to the fill aesthetic, it looks like geom_bar is calculating the default width separately for each level of type. The minimum distance between values of Duration_me for type=="A" is 1827 - 1096 = 731, meaning the bar widths for type="A" should therefore be 657.9.
If you run the following code, where we use the default bar width or a hard-coded bar-width of 657.9, (we also set the x-axis limits so that the type=="B" values aren't plotted), you can see that indeed this is the case:
library(ggplot2)
library(patchwork)
theme_set(theme_classic())

p = mydata %>%
  ggplot(aes(x = Duration_me, fill=type)) +
    scale_x_continuous(limits=c(650,2200),
                       breaks=c(unique(mydata$Duration_me),
                                1096 + 657.9/2*c(-1,1)))

{p + geom_bar()} / {p + geom_bar(width=657.9)}
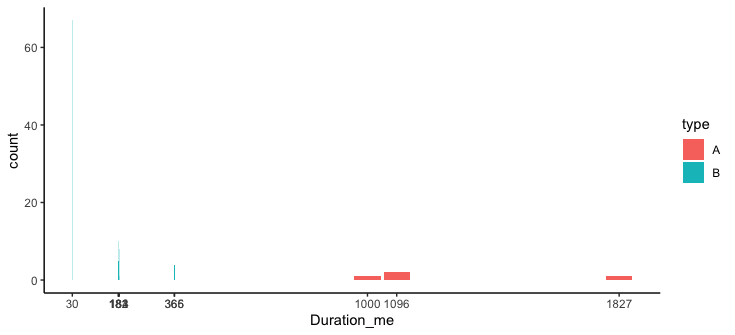
On the other hand, the minimum distance between values of Duration_me for type=="B" is only 1, resulting in thin bars.
If we make the following change to the data:
mydata[1,2] = 1000
reducing the minimum resolution to 96 for type=="A", and then redo the plot, we see that the bar widths now reflect the new resolution.
mydata %>%
  ggplot(aes(x = Duration_me, fill=type)) +
    geom_bar() +
    scale_x_continuous(breaks=unique(mydata$Duration_me))
As you noted, you can change this behavior with the width argument, but the fact that the default gives different widths for different levels of the fill variable was counterintuitive to me.