--Hi,
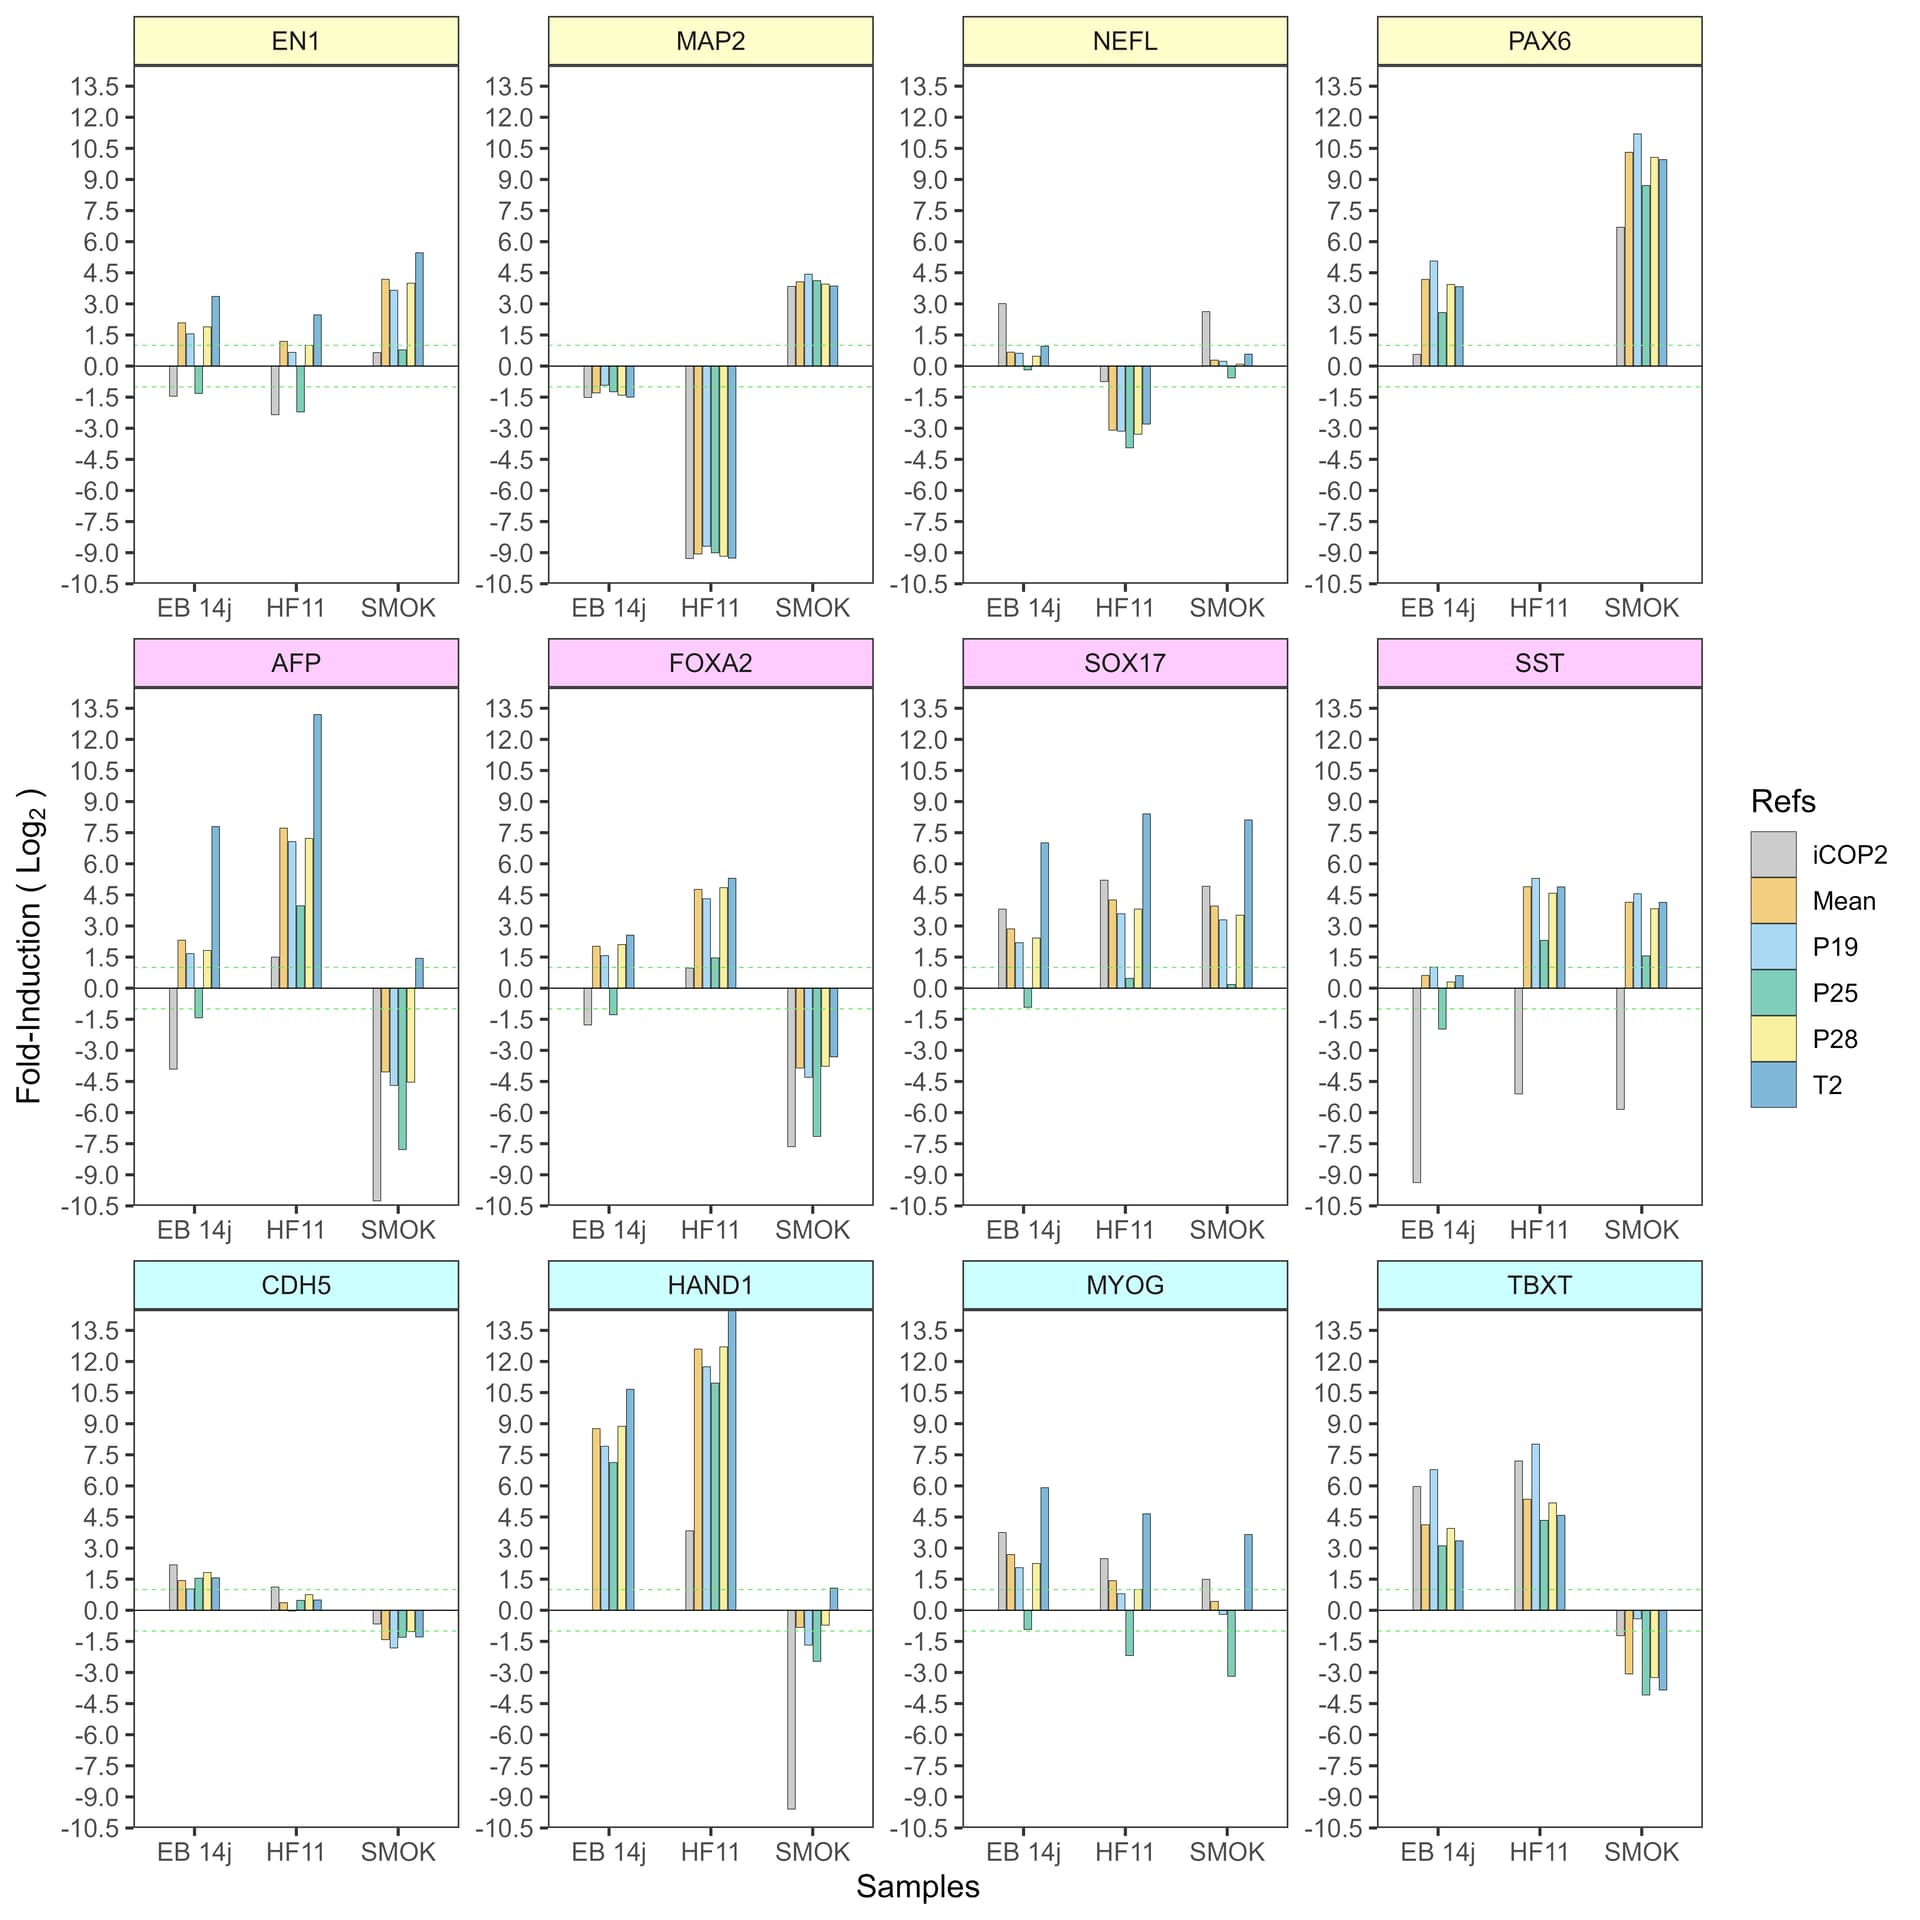
i try to generate a plot with ggplot using facet_wrap function but it failed to color
the barplot (i have the same color for all the barplot) and again for the strip.background of each group of facet.
my code here:
library(ggplot2)
library(tidyverse)
library(extrafont)
library(reshape2)
library(ggbreak)

Data <- data.frame(sample=as.character(unlist(lapply(c("Ref","EB 14j","HF11"),function(x) {rep(x,12)}))),
target=as.character(unlist(rep(c("EN1","MAP2","NEFL","PAX6","AFP","FOXA2","SOX17","SST","CDH5","HAND1","MYOG","TBXT"),3))),
ratio=as.numeric(unlist(c(1,1,1,1,1,1,1,1,1,1,1,1,4.24137,0.406923398,1.5932461,18.1362,4.977376,4.059928,7.260578,1.529779,2.704227,434.6353,6.443263,
17.46668,2.28697,0.001868545,0.1174228,0,210.767971,27.189933,19.108250,29.692244,1.290268,6193.3215,2.692950,40.94221))),
color=as.character(unlist(lapply(c("#38C0DC","#dcdcdc","#b4b4b4"),function(x) {rep(x,12)}))))

theme_set(theme_bw(base_size=12, base_family='Roboto Condensed')+
    theme(panel.grid.major = element_blank(),
    panel.grid.minor = element_blank()))

theme_set(theme_grey())

target <- c("EN1","MAP2","NEFL","PAX6","AFP","FOXA2","SOX17","SST","CDH5","HAND1","MYOG","TBXT")
FM <- c("#FFFFCC","#FFFFCC","#FFFFCC","#FFFFCC","#FFCCFF","#FFCCFF","#FFCCFF","#FFCCFF","#CCFFFF","#CCFFFF","#CCFFFF","#CCFFFF")  # 3 groups of colors need to be affected to each 3 groups of targets

p <- ggplot(Data, aes(x=fct_relevel(sample, "Ref"), y=as.numeric(ratio))) +
geom_col(position = position_dodge2(width = 0.4, preserve = "single"), colour = "black", alpha=.5, width=.5, size=0.1) +
scale_y_continuous(breaks = c(0,1,6500), expand = expansion(mult = c(0, .1))) +
scale_fill_manual(Data$sample,values = Data$color) +
labs(x = 'Samples',y='Fold-Induction') +
facet_wrap(~target, scales='free', drop = TRUE) +
theme_bw() +
theme(axis.text.x = element_text(vjust = 1, hjust=1, color="black", size=5, angle = 80),plot.margin = margin(5, 5, 5, 5, "mm"),legend.position = 'none',panel.spacing = unit(0.2, "lines")) +
theme(axis.text.y = element_text(vjust = 0.2 ,color="black", size=5),legend.position = 'none',panel.spacing = unit(0.5, "lines")) +
theme(axis.title.y = element_text(vjust = 0.1, color="black", margin = margin(t = 0, r = 6, b = 0, l = 0), size=6, family="Roboto Condensed", face="plain")) +
theme(axis.title.x = element_text(vjust = 0.5, color="black", margin = margin(t = 10, r = 6, b = 0, l = 0), size=6, family="Roboto Condensed", face="plain")) +
theme(
axis.ticks = element_line(color = "black", size = 0.1),
axis.ticks.length = unit(2,"pt"),
axis.ticks.x=element_blank(),
panel.grid.major.y=element_line(color="gray91",size = 0.20, linetype = 3),
panel.grid.minor.y=element_blank(),
panel.grid.major.x=element_blank(),
panel.grid.minor.x=element_blank(),
panel.spacing = unit(1, "lines"),
panel.spacing.x = unit(0.2, "lines"), # control space between facet
strip.text = element_text(face="bold", size=6,colour="black",lineheight=3.0),
panel.border = element_rect(color = "#38C0DC"),
strip.background = element_rect(fill=FM, colour="#38C0DC",size=0.5)
)

# One facet need to have a break in Y axis because we have high values
# p + scale_y_cut(breaks=c(20), which=c(1, 2), scales=c(3, 0.5), space=.001)
also i need to create a break on y axis only in one facet but it failed