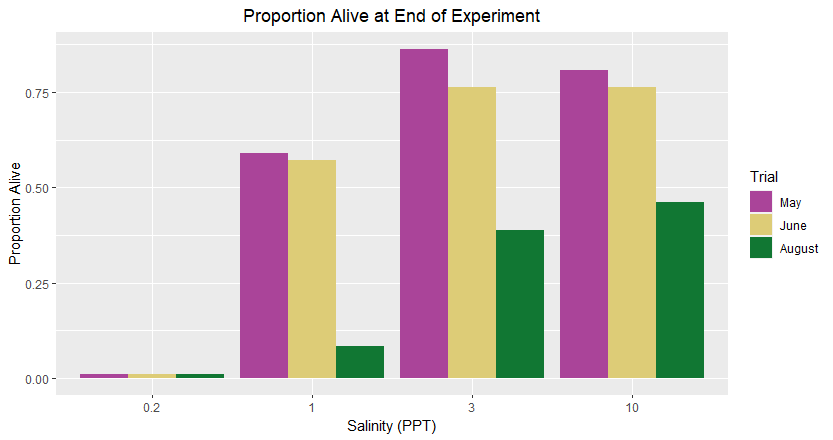
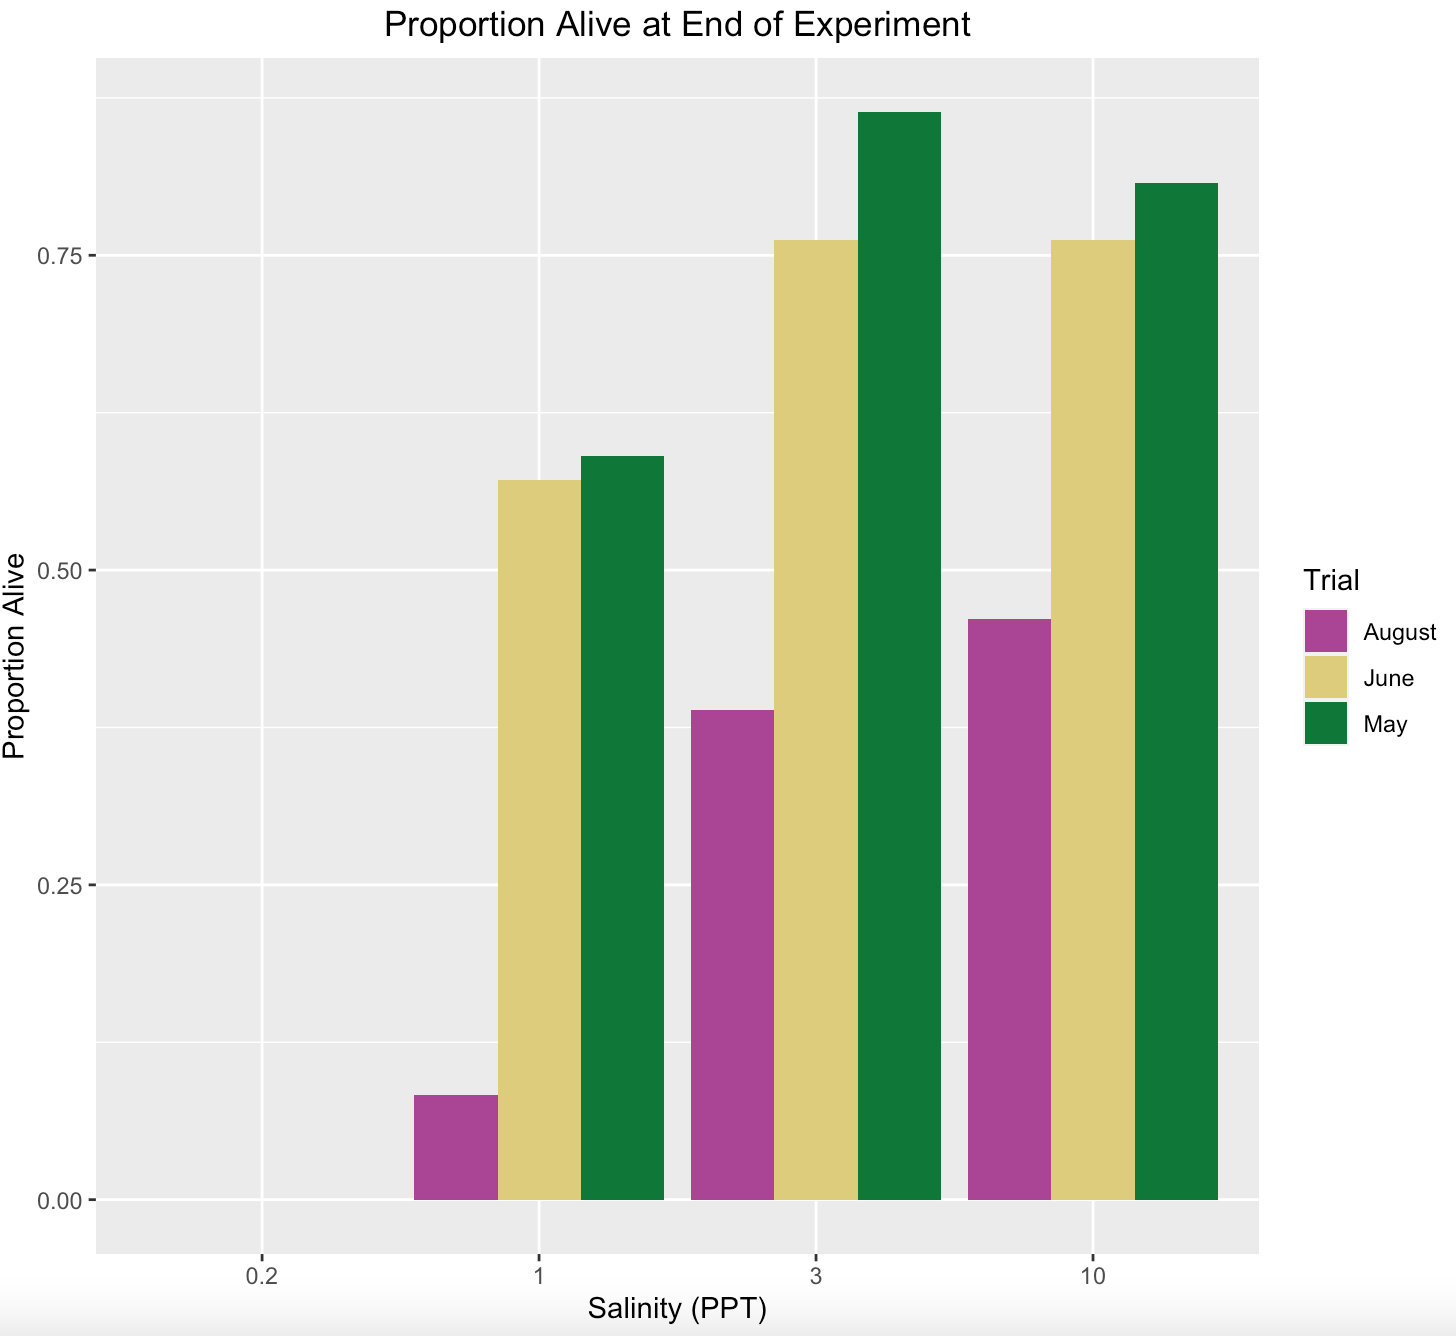
Hello, I was wondering if someone could help me with this. My current clustered chart ends up putting the months in order of August, June, May for each salinity treatment, but I need it to be in the order May, June, August. Does anyone know how to fix this?
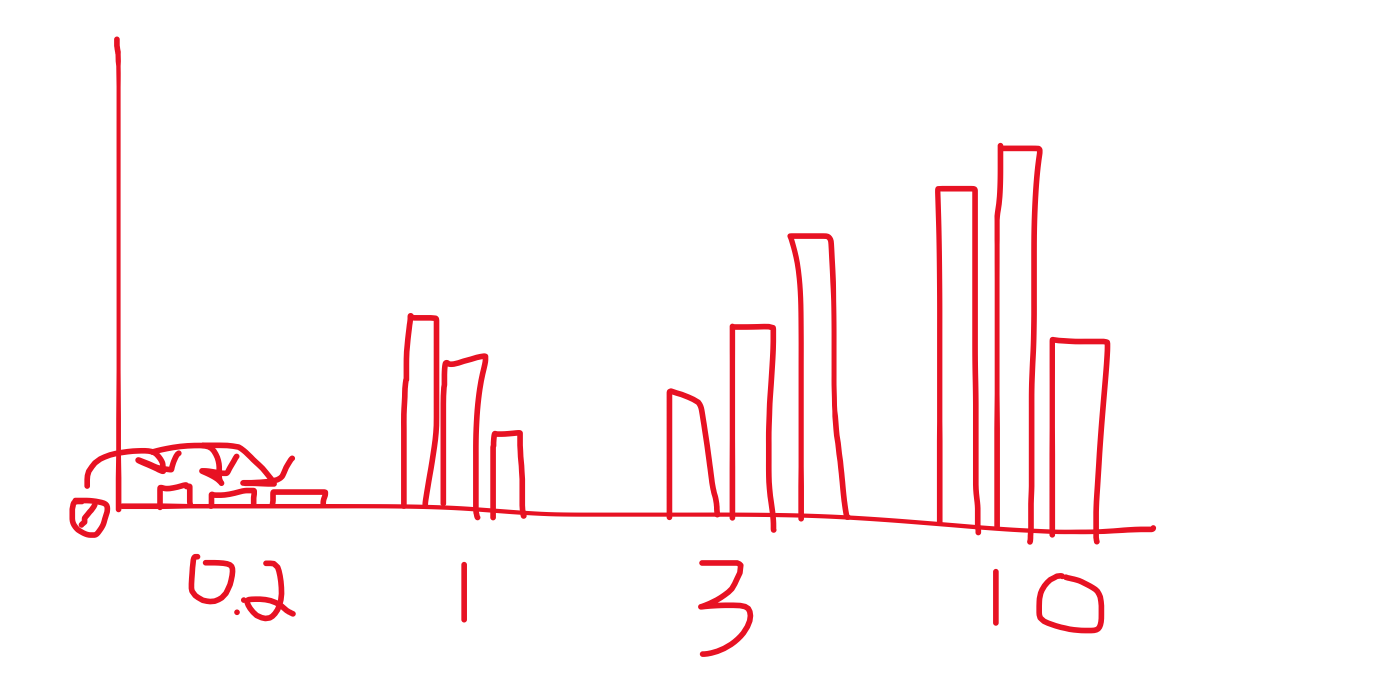
Also, is it possible to add clustered bars to above the 0.2 PPT salinity? The proportion alive was 0 for each of those trials but it isn't showing it on the x-axis.
Any help is appreciated. Thank you!
WithinSQ_Proportion = read.csv("/Users/haley/documents/Thesis/WithinSQ_Proportion.csv")
WithinSQ_Proportion$Trial <- as.factor(WithinSQ_Proportion$Trial)
sq <- ggplot(WithinSQ_Proportion, aes(x = factor(Salinity), y = Proportion, fill = Trial)) +
  geom_col(position = "dodge") + ggtitle("Proportion Alive at End of Experiment") +
  theme(plot.title = element_text(hjust = 0.5)) +
  xlab("Salinity (PPT)") + ylab("Proportion Alive")

sq + scale_color_manual(values=c("#AA4499", "#DDCC77", "#117733")) +
  scale_fill_manual(values=c("#AA4499", "#DDCC77", "#117733"))