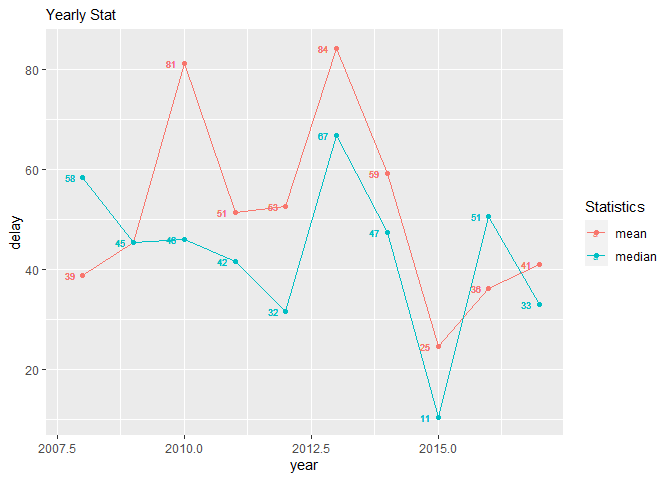
In the following example, I would like to do the following:
- Change xlab and ylab ( I tried but x and y labs are not changing).
- Present years as integers i.e. get rid of decimals in x-axis.
- Show all the years.
suppressWarnings(suppressMessages(library(tidyverse)))
#######
# Data
#######
set.seed(123)
toy_data <- tibble(
  year = 2008:2017,
  mean = rnorm(10, mean = 50, sd = 20),
  median = rnorm(10, mean = 40, sd = 15)
) %>%
  pivot_longer(
    cols = mean:median,
    names_to = "stats",
    values_to = "delay"
  )
#######
# Plot
######
toy_data %>%
  ggplot(aes(x = year, y = delay , color = stats)) +
  geom_line() +
  geom_point() +
  stat_summary(geom = "text", fun = quantile,
               aes(label=sprintf("%1.0f", ..y..)),
               position = position_nudge (x= -0.25), size=2.5) +
  labs(
    subtitle = "Yearly Stat",
    color = "Statistics",
    ylab = "Delay",
    xlab = "Year"
  )
Created on 2020-11-15 by the reprex package (v0.3.0)
FJCC
2
Try the following. Notice that I set the breaks of the scale and within labs() I set x and y, not xlab and ylab.
library(ggplot2)
library(dplyr,warn.conflicts = FALSE)
library(tidyr)
library(tibble)

set.seed(123)
toy_data <- tibble(
  year = 2008:2017,
  mean = rnorm(10, mean = 50, sd = 20),
  median = rnorm(10, mean = 40, sd = 15)
) %>%
  pivot_longer(
    cols = mean:median,
    names_to = "stats",
    values_to = "delay"
  )
#######
# Plot
######
toy_data %>%
  ggplot(aes(x = year, y = delay , color = stats)) +
  geom_line() +
  geom_point() +
  stat_summary(geom = "text", fun = quantile,
               aes(label=sprintf("%1.0f", ..y..)),
               position = position_nudge (x= -0.25), size=2.5) +
  labs(
    subtitle = "Yearly Stat",
    color = "Statistics",
    y = "Delay",
    x = "Year"
  ) +
  scale_x_continuous(breaks = 2008:2018)
Thank you! Just what I wanted 
system
Closed
4
This topic was automatically closed 7 days after the last reply. New replies are no longer allowed.
If you have a query related to it or one of the replies, start a new topic and refer back with a link.