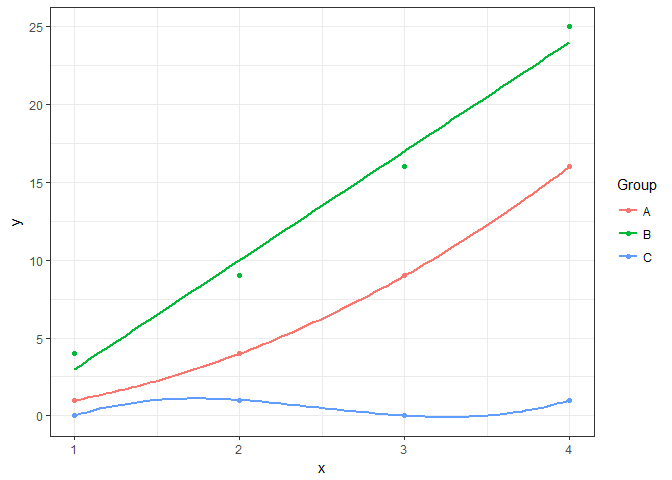
I'm not sure there's a way to do that built-in to geom_smooth. I think the method.args argument just passes fixed values, and I'm not sure it would work well with formula even if it did. I put together something hackily "functional" using purrr::reduce2, since I actually have a similar problem that I'll be working on soon.
suppressPackageStartupMessages(library(tidyverse))

# Sample data
dat <-
  structure(
    list(
      Group = c("A", "A", "A", "A", "B", "B", "B", "B",
                "C", "C", "C", "C"),
      Order = c(2, 2, 2, 2, 1, 1, 1, 1, 3, 3, 3, 3),
      x = c(1, 2, 3, 4, 1, 2, 3, 4, 1, 2, 3, 4),
      y = c(1, 4, 9, 16, 4, 9, 16, 25, 0, 1, 0, 1)
    ),
    .Names = c("Group", "Order",
               "x", "y"),
    row.names = c(NA, 12L),
    class = c("tbl_df", "tbl", "data.frame")
  )

dat
#> # A tibble: 12 x 4
#>    Group Order     x     y
#>  * <chr> <dbl> <dbl> <dbl>
#>  1     A     2     1     1
#>  2     A     2     2     4
#>  3     A     2     3     9
#>  4     A     2     4    16
#>  5     B     1     1     4
#>  6     B     1     2     9
#>  7     B     1     3    16
#>  8     B     1     4    25
#>  9     C     3     1     0
#> 10     C     3     2     1
#> 11     C     3     3     0
#> 12     C     3     4     1

# Find the unique Group/Order combinations
dat %>% select(Group, Order) %>% distinct() %>%
# Then graph them
{
  reduce2(.init = ggplot(data = dat, aes(x = x, y = y, color = Group)),
          .x = .$Group,
          .y = .$Order,
          function(prev, .x, .y) {
            force(.y) # The formula below won't evaluate .y by itself
            prev + geom_smooth(
              data = dat %>% filter(Group == .x),
              method = "lm",
              se = FALSE,
              formula = y ~ poly(x, .y))
          })
} +
# Show that we still have a valid ggplot object
  geom_point() +
  theme_bw()

