In command line, ggplot(...) can plot a picture and show it in Rstudio, but when put the ggplot(...) in other function such as follows:
test_fun <- function() {
ggplot(...)
}
It will not show the plot in Rstudio.
but as shown in following:
plot_f <- ggplot(...)
test_fun <- function(plot_name) {
plot_name
}
test_fun(plot_f)
it could plot the image. why? Is it a bug?
Flm
2
test_fun <- function() {
ggplot(...)

print(test_fun)

}
I am unable to reproduce your issue... what exactly are you trying to do? Are you trying to wrap a ggplot in your own function?
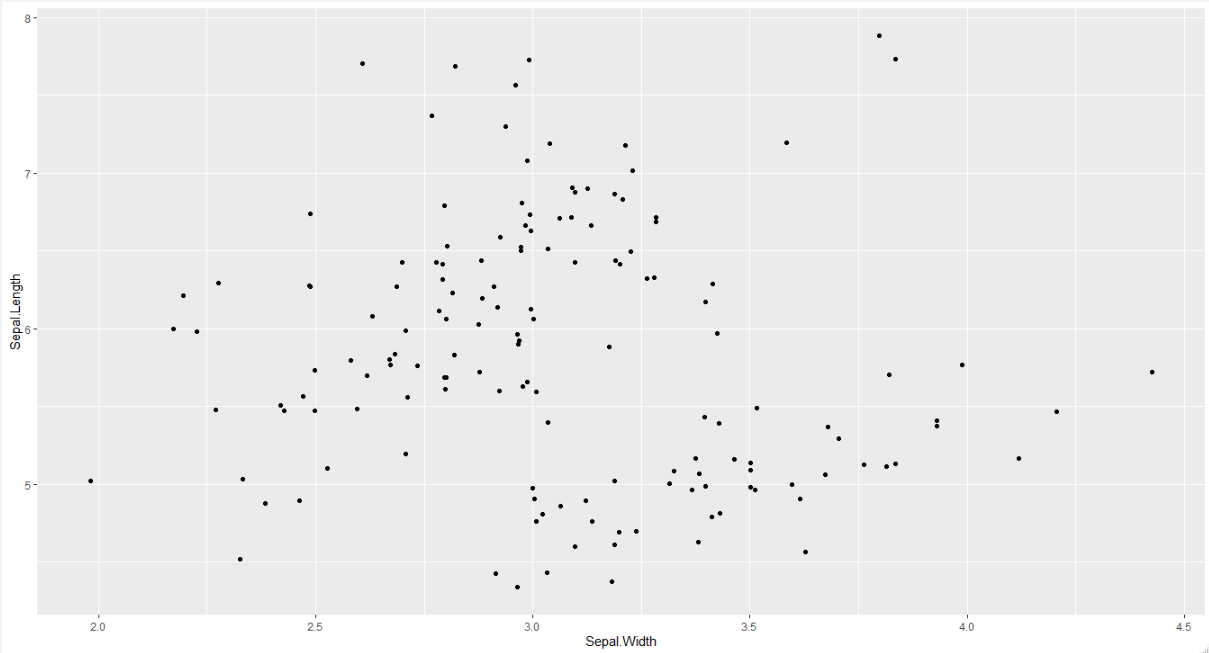
library(tidyverse)

test_fun <- function() {
    iris %>%
        ggplot(aes(x = Sepal.Width, y = Sepal.Length)) +
        geom_jitter()
}

test_fun()
system
Closed
4
This topic was automatically closed 21 days after the last reply. New replies are no longer allowed.
If you have a query related to it or one of the replies, start a new topic and refer back with a link.