Tom3
February 17, 2021, 11:07pm
1
Hello together,
this is my code:
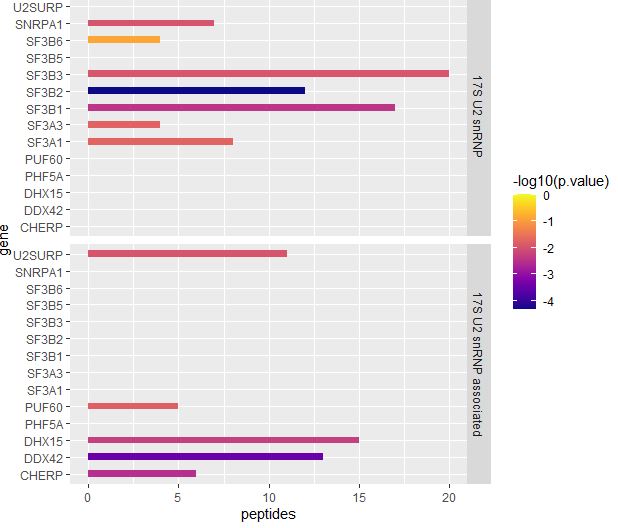
ggplot(XLINKFORR,aes(x=gene,y=peptides,fill=-log10(p.value))) +
This is my plot
My Problem is that in the Plot all genes are repeated (U2SURP - CHERP), but only CHERP
See the FAQ: How to do a minimal reproducible example reprex for beginners . Questions like this are much easier to troubleshoot, and far more likely to attract useful answers, with a complete reprex, including representative data.
Here is one approach
(XLINKFORR <- data.frame(
  gene=factor(letters[c(1,2,1,3)]),
  family=c(1,1,2,2),
  peptides=c(12,21,31,14),
  p.value=(1:4)/40
))
library(viridis)
library(tidyverse)

(virid_scale_extent <- range(-log10(XLINKFORR$p.value)))


# ggplot(XLINKFORR,aes(x=gene,y=peptides,fill=-log10(p.value))) +
#   geom_col(position="stack",width=0.4)+
#   coord_flip() + scale_fill_viridis(option="plasma",limits=virid_scale_extent)+
#   facet_grid(family~.)
#

(split_df <- XLINKFORR %>%
    group_by(family) %>%
    group_split())

split_df_recode <- map(split_df,~mutate(.,
                     gene=factor(gene)))

library(cowplot)

base_plot_func <- function(x){
  ggplot(x,aes(x=gene,y=peptides,fill=-log10(p.value))) +
    geom_col(position="stack",width=0.4) +
    coord_flip() + scale_fill_viridis(option="plasma",
                                      ,limits=virid_scale_extent)
}


plots <- purrr::map(split_df_recode,
                    ~{base_plot_func(.x) +
                        theme(legend.position = "none")
                        })

g1 <- plot_grid(plotlist=plots,
          labels=unique(XLINKFORR$family),
          nrow = 2)

# extract the legend from one of the plots
legend <- get_legend(
  # create some space to the left of the legend
  base_plot_func(split_df_recode[[1]]) + theme(legend.box.margin = margin(0, 0, 0, 12))
)

# add the legend to the row we made earlier. Give it one-third of
# the width of one plot (via rel_widths).
plot_grid(g1, legend, rel_widths = c(6,1))
Tom3
February 18, 2021, 2:07am
4
Thank you very much, it works! Really a big help for me - will take me a while to really understand the process but your comments help.
p.s. sorry for not shortening my question to an example
Tom3
February 18, 2021, 4:00pm
5
Additional question:
system
March 11, 2021, 4:00pm
6
This topic was automatically closed 21 days after the last reply. New replies are no longer allowed.