ggplot 2 warning: aesthetics dropped ... : fill

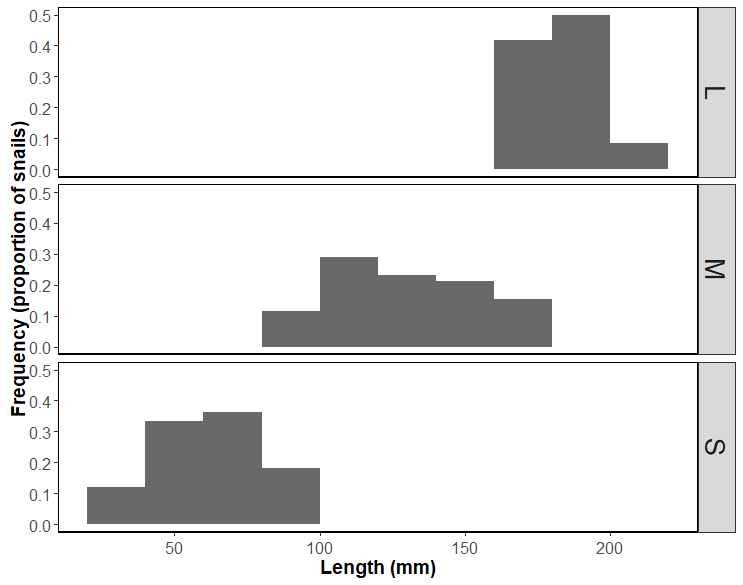
I am using code from a previous project and am receiving the below warning messages and the output is not showing different coloured bars or legend. Can someone please advise edits to code?

warning message:
Warning messages:
1: The following aesthetics were dropped during statistical transformation: fill.
:information_source: This can happen when ggplot fails to infer the correct grouping structure in the data.
:information_source: Did you forget to specify a group aesthetic or to convert a numerical variable into a factor?
2: The following aesthetics were dropped during statistical transformation: fill.
:information_source: This can happen when ggplot fails to infer the correct grouping structure in the data.
:information_source: Did you forget to specify a group aesthetic or to convert a numerical variable into a factor?
3: The following aesthetics were dropped during statistical transformation: fill.
:information_source: This can happen when ggplot fails to infer the correct grouping structure in the data.
:information_source: Did you forget to specify a group aesthetic or to convert a numerical variable into a factor?

code:
ggplot(data=snail.data.qn, aes(length, y=20*after_stat(density), fill=year.factor))+
geom_histogram(position='dodge', binwidth=20, boundary=0, alpha=0.9)+
facet_grid(size~.)+
xlab("Length (mm)") +
ylab("Frequency (proportion of snails)") +
theme_bw() +
theme(panel.grid.minor=element_blank(), panel.grid.major=element_blank()) +
theme(panel.border = element_rect(linewidth=1, color = "black"))+
theme(legend.background = element_rect())+
theme(legend.justification=c(1,1), legend.position.inside=c(0.10,0.99)) +
theme(legend.title = element_text(size=14, face="bold")) +
theme(legend.text = element_text(size = 12)) +
theme(strip.text.x = element_text(size=20),
strip.text.y = element_text(size=20))+
theme(axis.title.x = element_text(face="bold", size=14),
axis.text.x = element_text(vjust=0.5, size=12))+
theme(axis.title.y = element_text(angle=90, vjust=0.45, face="bold", size=14),
axis.text.y = element_text(size=12))

Output:

1 Like

Please post the output of

dput(snail.data.qn)

Here is the output requested:

dput(snail.data.qn)
structure(list(site.factor = structure(c(1L, 1L, 1L, 1L, 1L,
1L, 1L, 1L, 1L, 1L, 1L, 1L, 1L, 1L, 1L, 1L, 1L, 1L, 1L, 1L, 1L,
1L, 1L, 1L, 1L, 1L, 1L, 1L, 1L, 1L, 1L, 1L, 1L), levels = c("QN",
"QS"), class = "factor"), year.factor = c(2024L, 2024L, 2024L,
2024L, 2024L, 2024L, 2024L, 2024L, 2024L, 2024L, 2024L, 2024L,
2024L, 2024L, 2023L, 2023L, 2023L, 2023L, 2023L, 2023L, 2023L,
2023L, 2023L, 2023L, 2023L, 2023L, 2023L, 2023L, 2023L, 2023L,
2023L, 2023L, 2023L, 2023L), size = structure(c(3L, 2L, 2L, 2L,
3L, 3L, 2L, 1L, 2L, 3L, 3L, 2L, 2L, 2L, 2L, 2L, 2L, 2L, 2L, 2L,
3L, 2L, 1L, 2L, 3L, 2L, 2L, 3L, 3L, 2L, 2L, 2L, 2L, 3L, 2L, 2L,
3L, 2L, 2L, 2L, 3L, 3L, 3L, 3L, 3L, 2L, 2L, 3L, 2L, 3L, 1L, 2L,
3L, 2L, 2L, 3L, 2L, 1L, 3L, 3L, 2L, 2L, 2L, 2L, 3L, 1L, 2L, 1L,
1L, 2L, 2L, 3L, 3L, 2L, 2L, 1L, 2L, 2L, 2L, 3L, 2L, 2L, 1L, 1L,
3L, 1L, 3L, 2L, 2L, 2L, 3L, 3L, 1L, 3L, 3L, 2L, 3L), levels = c("L",
"M", "S"), class = "factor"), live.dead = structure(c(2L, 1L,
2L, 2L, 1L, 1L, 1L, 1L, 2L, 2L, 2L, 2L, 1L, 2L, 2L, 2L, 2L, 2L,
2L, 2L, 1L, 1L, 1L, 1L, 2L, 2L, 2L, 2L, 2L, 1L, 1L, 1L, 1L, 1L,
1L, 1L, 1L, 1L, 1L, 1L, 1L, 1L, 1L, 1L, 1L, 1L, 1L, 1L, 1L, 1L,
2L, 1L, 1L, 1L, 1L, 1L, 1L, 1L, 1L, 1L, 1L, 1L, 1L, 1L, 1L, 1L,
1L, 1L, 1L, 1L, 1L, 2L, 1L, 1L, 1L, 1L, 1L, 1L, 1L, 2L, 1L, 1L,
1L, 1L, 2L, 1L, 1L, 1L, 1L, 1L, 2L, 2L, 2L, 2L, 1L, 2L, 1L), levels = c("A",
"D"), class = "factor"), length = c(73L, 144L, 133L, 168L, 51L,
81L, 168L, 190L, 117L, 77L, 78L, 101L, 168L, 155L, 167L, 146L,
130L, 152L, 164L, 153L, 57L, 104L, 180L, 152L, 81L, 137L, 90L,
69L, 54L, 171L, 120L, 140L, 103L, 80L, 114L, 108L, 84L, 129L,
135L, 134L, 57L, 65L, 69L, 67L, 85L, 130L, 137L, 80L, 110L, 82L,
206L, 92L, 73L, 144L, 99L, 34L, 135L, 180L, 82L, 40L, 109L, 167L,
117L, 91L, 41L, 175L, 95L, 183L, 191L, 92L, 120L, 47L, 56L, 152L,
117L, 182L, 145L, 104L, 111L, 36L, 122L, 170L, 200L, 181L, 71L,
174L, 46L, 149L, 112L, 140L, 26L, 64L, 174L, 48L, 57L, 141L,
43L)), row.names = c(33L, 34L, 35L, 36L, 37L, 38L, 39L, 40L,
41L, 42L, 43L, 44L, 45L, 46L, 47L, 48L, 49L, 50L, 51L, 52L, 53L,
54L, 55L, 56L, 57L, 58L, 59L, 60L, 61L, 62L, 63L, 64L, 65L, 66L,
67L, 68L, 69L, 70L, 71L, 72L, 73L, 74L, 75L, 76L, 77L, 78L, 79L,
80L, 81L, 82L, 116L, 117L, 118L, 119L, 120L, 121L, 122L, 123L,
124L, 125L, 126L, 127L, 128L, 129L, 130L, 131L, 132L, 133L, 134L,
135L, 136L, 137L, 138L, 139L, 140L, 141L, 142L, 143L, 144L, 145L,
146L, 147L, 148L, 149L, 150L, 151L, 152L, 153L, 154L, 155L, 156L,
157L, 158L, 159L, 160L, 161L, 162L), class = "data.frame")

For reference, I am trying to get the plot to resemble the below:
With size (S/M/L) replacing the years on the right axis, length (mm) for the X axis, and year (2023/2024) replacing the burn factor.

Appreciate your help :slight_smile:

1 Like

Make sure year.factor is a factor. If I add,

snail.data.qn$year.factor <- factor(snail.data.qn$year.factor)

the code works

2 Likes

Thank you so much! Added the line of code and it works now :slight_smile: