ggplot 2 columns

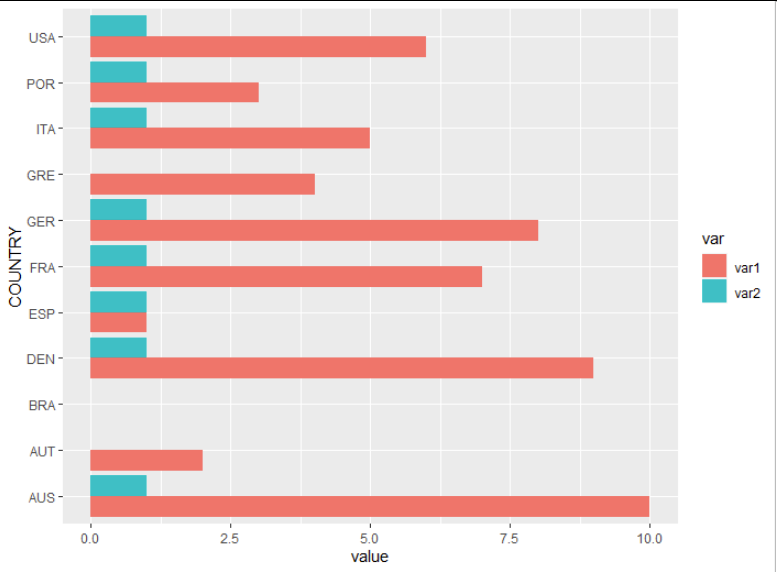
Hi, I would like to make a ggplot with the var1 and the var2 of my code as columns at the same time

Here is my code

data <- data.frame (COUNTRY = c ("ESP", "AUT", "POR", "GRE", "ITA", "USA", "FRA", "GER", "DEN", "BRA", "AUS"),
                       var1 = c(1, 2, 3, 4, 5, 6, 7, 8, 9, NA, 10), 
                       var2 = c (1, 0, 1, 0, 1, 1, 1, 1, 1, 0, 1))

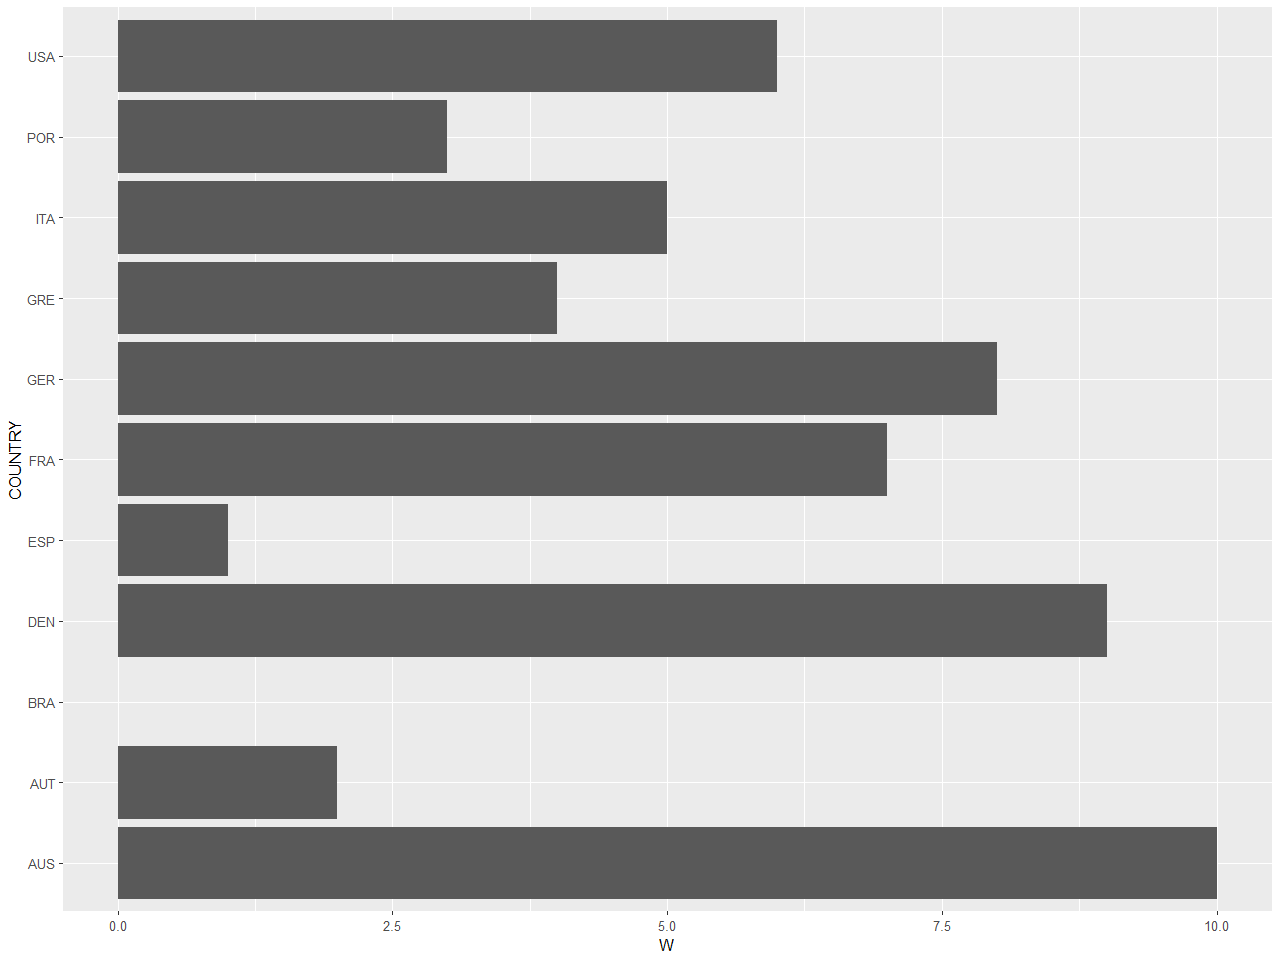
ggplot(data, aes(var1 , COUNTRY)) +
  geom_col()

I have this ggplot but I would like to see the two variables per country in the same plot. I tried some ways but I always have an error

like this?

data_long = tidyr::pivot_longer(data, -COUNTRY, 
                                names_to = "var", values_to = "value")
# plot 
ggplot(data_long, aes(x = COUNTRY,
                 y = value,
                 fill = var)) +
  geom_col(position = position_dodge()) + # show bars side by side
  coord_flip()

1 Like

This topic was automatically closed 7 days after the last reply. New replies are no longer allowed.

If you have a query related to it or one of the replies, start a new topic and refer back with a link.