ggcoefstats error bars don't appear

Hi, everyone.

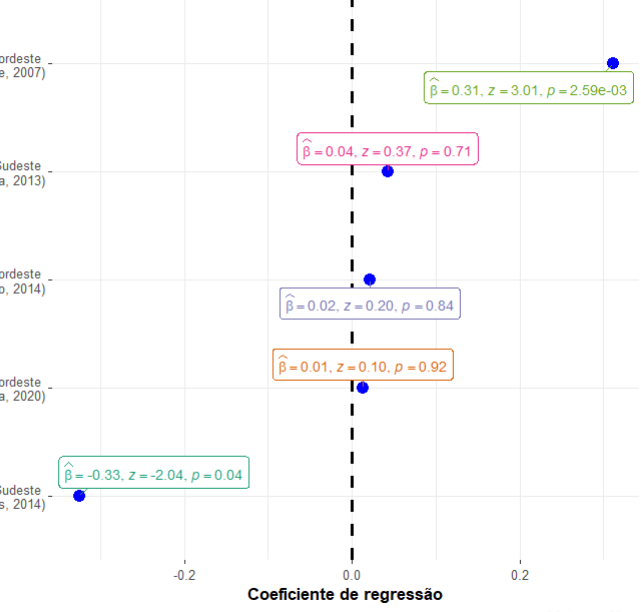
So, I'm trying to do a basic meta-analysis, and I used the ggstatsplot::ggcoefstats to create a plot with the different data I'm analysing. The problem is: the error bars don't appear no matter what I do.
I've created a data frame with term, estimates, std.error, statistic and p-value.

And then I used the function with statistc = 'z'. It generates the plot, but with no error bars (I've tried putting conf.int = T, but it doesn't change anything


Does anyone know how to fix this?

I think we need a https://forum.posit.co/t/faq-how-to-do-a-minimal-reproducible-example-reprex-for-beginners/2306

df <-
structure(
list(
term = structure(
1:5,
.Label = c("Sudeste \n (Nunes, 2014)", "Nordeste \n (Lopes da Silva, 2020)", "Nordeste \n (Cavalcante, 2007)",
"Nordeste \n (Nascimento, 2014)", "Sudeste \n (Rocha, 2013)"),
class = "factor"
),
estimate = c(
-0.3251,
0.01256,
0.31100,
0.02093,
0.04215
),
std.error = c(
0.1591,
0.12954,
0.10325,
0.10321,
0.11502
),
statistic = c(
-2.043,
0.097,
3.012,
0.203,
0.366
),
p.value = c(
0.0411,
0.923,
0.00259,
0.839,
0.714
),
df.residual = c(
828,
2095,
1910,
2227,
5601
)
),
row.names = c(NA, -5L),
class = c("tbl_df", "tbl", "data.frame")
)

ggcoefstats(
x = df,
statistic = "z",
sort = "ascending",
title = "Influência do Gênero no Uso da Negação Dupla em relação à Negação Pré-verbal \n nas regiões Nordeste e Sudeste",
ylab = "Amostras",
xlab = "Coeficiente de regressão",
caption = "Meta-análise"
)

My best guess, and it is only a guess, is that you are giving it a tibble and it wants a model.

See Supported Models at ggcoefstats

Example

reg1  <- lm(mpg ~ cyl, data = mtcars)

ggcoefstats(
  x = reg1,
  title = "John's ",
  subtitle = "(for censored data)",
  k = 2
)

I've used a tutorial that made that plot with a data.frame as well and the erro bars appeared.

Well, I said it was a guess. I have never used ggstatsplot so I have no feel for its peculiarities. Can you point me to the tutorial?

I see that the author says a "tidy data frame from a regression model" will work.

How did you create the tibble? And why?

Well, I said it was a guess. I have never used ggstatsplot so I have no feel for its peculiarities. Can you point me to the tutorial?

How did you create the tibble?

Sorry, I didn't mean to be rude.

The tutorial is in Portuguese, but it is this one: Como fazer meta-análise com dados socioliguísticos?
(it is in the bottom of the text)

As for the tibble, I've created with the code I provided in the comment above. I created it because I want to compare the size effects of 5 studies in the same plot, it was the only way I knew to put all the data in the same plot. If you know another way to do that, it would really help me, sir. Thanks for trying to help me anyway.

Ah, thanks. My Portuguese is nonexistent. It looks like I can get an idea of what the tutorial is doing with Google Translate/DeepL and Yandex Translator and the code seems pretty clear. I'll have a look at it tomorrow but we probably need someone who knows something about the package and what a tidy data.fame is supposed to look like.

Sorry not to be of more help.

Hi, sorry to take so long getting back to you.

I managed to work through the tutorial; quite a good one. I cannot get that data.frame in the tutorial to work. It is no problem to get error bars on the the various models but not in the data.frame example. I, even, duplicated the data set manually and no luck, (there is a typo. One of the df.residuals is wrong).

I wonder if there has been some very recent change and the tutorial is a bit out of date?

Thanks for trying to help. It is from 2021, two years ago. Do you know some other ways to do a good meta-analysis like this one that put together all the models in the same plot?

Not off the top of my head. I would suggest having a look at the CRAN taskview for Meta-Analysis. CRAN Task View: Meta-Analysis if someone does not read this and answer here.

You might also email the package author or maintainer and ask about this.

1 Like

This topic was automatically closed 42 days after the last reply. New replies are no longer allowed.

If you have a query related to it or one of the replies, start a new topic and refer back with a link.