Hello everyone, I'm using RStudio Version 1.4.1103, R version 4.0.3 (2020-10-10), on a Windows 10 computer. I've been trying and failing to get the labels of my PCA graph to correspond to the names of the rows in my excel document. I tried running PCA on python and ran into the same problem so I think I may just be misunderstanding something.
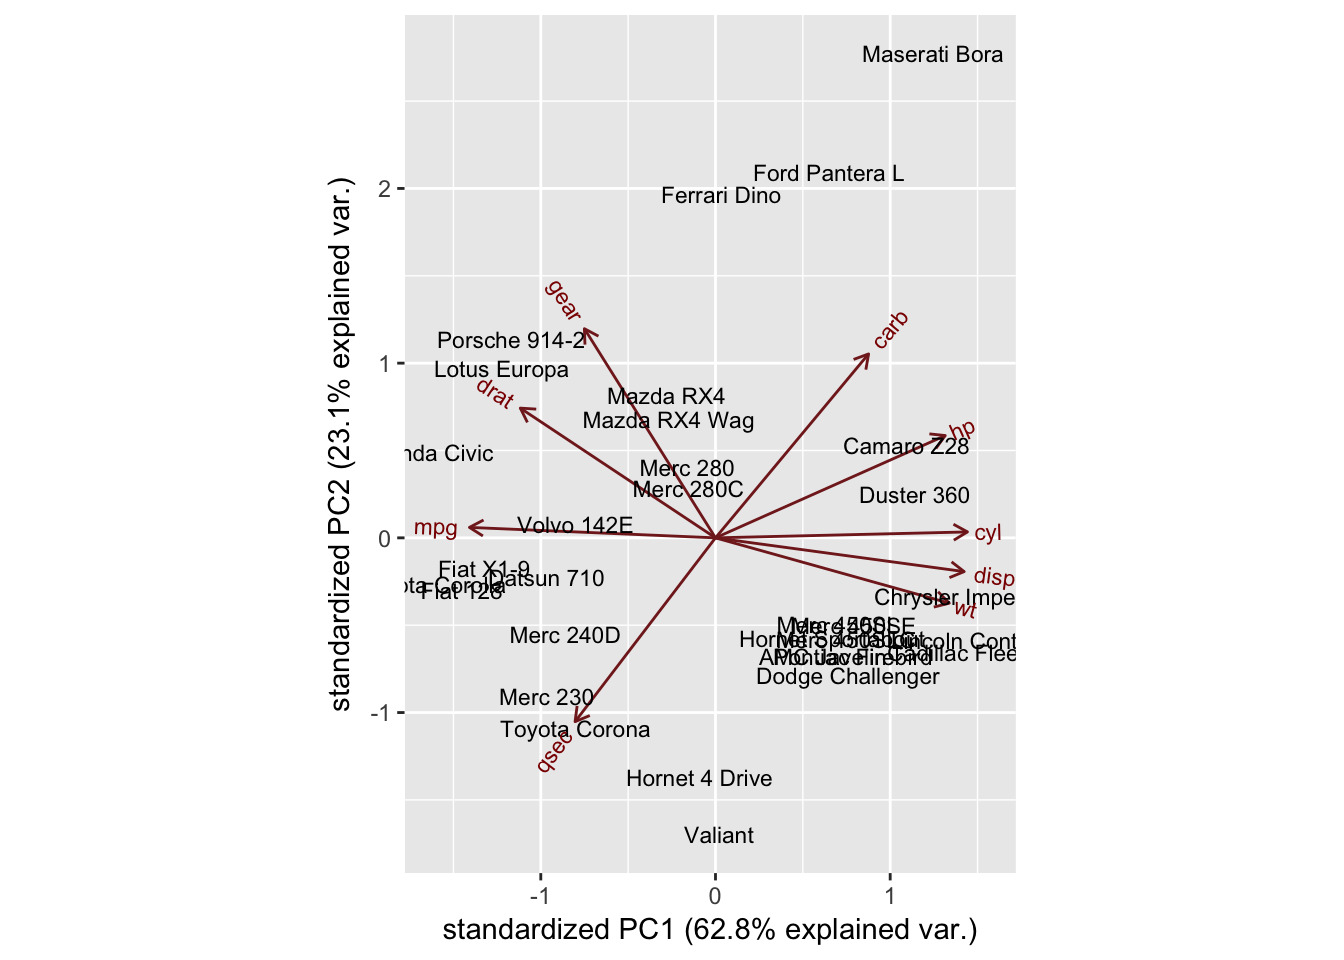
When I run my final line of code, although I have a string in column 1 of my excel document, it's printing the labels as "1", "2", "3"., etc. In python, I get the error "can't convert string to float". I'm guessing that the code I'm using is only capable of processing non-string data. If this is so, how is it possible for it to read the names I have assigned for each row and have it plot them on the graph (like the MTcars example, where all the car makes and models are placed on the graph)?
install.packages("readxl")
library("readxl")
library(ggbiplot)
library(devtools)
#install_github("vqv/ggbiplot")

#Data from fecal analysis
poopdata <-read_excel("C:/Users/16135/Desktop/Lab/NISE Lab/4. McCormickLab_Paper/Pipeline Data/16sDataFamily.xlsx", sheet = 2)
poopconvert <-prcomp(poopdata, center = TRUE, scale = TRUE)
summary(poopconvert)
str(poopconvert)


ggbiplot(poopconvert,choices = c(1,2), labels=rownames(poopconvert))