Hi together,
I am aiming to create a simple timeline with points in gganimate. However, since hours I cannot get my head around what is wrong with my example. I reduced to be fairly simple but still, lines and points do not take the same path. Moreover, points multiply even though there is only one observation per group per time step (Day). I am also wondering why some points for soem days x groups are kept and others are not which is likely a hint but I cannot figure it out.
Edit: I also tried different eas_aes() but without any obviosu changes in the reuslting animation.
The example provided by @thomasp85, which is more or less the same animation, works like a charm.
What am I missing?
library(tidyverse)
library(gganimate)
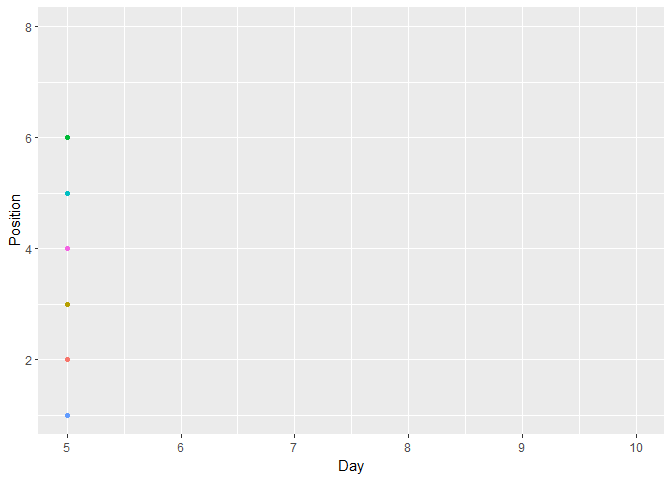
structure(
list(
Day = c(10L, 10L, 9L, 10L, 9L, 10L, 10L, 10L,
9L, 9L, 7L, 8L, 8L, 8L, 8L, 9L, 9L, 6L, 7L, 7L, 7L, 7L, 8L, 8L,
5L, 6L, 6L, 6L, 6L, 7L, 5L, 6L, 5L, 5L, 5L, 5L),
Position = c(1L, 2L, 1L, 3L, 2L, 4L, 5L, 6L, 3L, 5L, 1L, 1L, 3L, 4L, 5L, 6L, 7L,
1L, 3L, 4L, 5L, 6L, 6L, 7L, 1L, 2L, 3L, 4L, 5L, 8L, 2L, 8L, 3L,
4L, 5L, 6L),
Club = c("Borussia M'gladbach", "Borussia Dortmund",
"Borussia M'gladbach", "RB Leipzig", "Bayern Munich", "Bayern Munich",
"SC Freiburg", "FC Schalke 04", "SC Freiburg", "Borussia Dortmund",
"Borussia M'gladbach", "Borussia M'gladbach", "Bayern Munich",
"Borussia Dortmund", "RB Leipzig", "RB Leipzig", "FC Schalke 04",
"Bayern Munich", "Bayern Munich", "SC Freiburg", "RB Leipzig",
"FC Schalke 04", "SC Freiburg", "FC Schalke 04", "RB Leipzig",
"RB Leipzig", "SC Freiburg", "FC Schalke 04", "Borussia M'gladbach",
"Borussia Dortmund", "Bayern Munich", "Borussia Dortmund", "Borussia Dortmund",
"SC Freiburg", "FC Schalke 04", "Borussia M'gladbach")),
class = c("tbl_df", "tbl", "data.frame"),
row.names = c(NA, -36L)) %>%
ggplot(aes(Day, Position, color = Club)) +
geom_line(show.legend = F) +
geom_point(show.legend = F) +
transition_reveal(Day)
Created on 2019-12-19 by the reprex package (v0.3.0)
Thank you and all the best,
Cédric