How do I combine the geom_smooth(method = "lm) function with gganimate()'s transition_layers(), so that, as the individual bars drift/grow upwards, the linear line of geom_smooth() appears, like so: [Example of desired appearance of geom_smooth() line] The only difference is that in my case, instead of the points, the bars would drift upwards as the line appears.
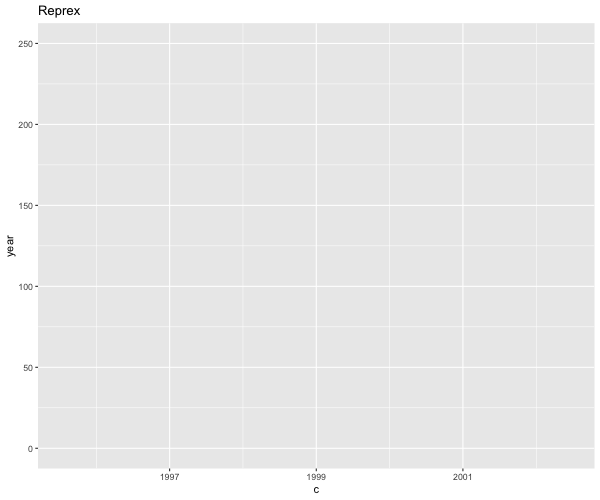
The bars currently work well, appearing by drifting upwards, made possible by using the transition_layers() function of gganimate().
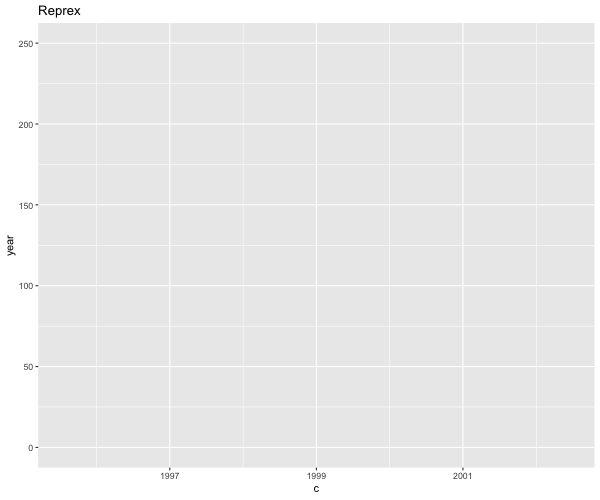
However, I can't figure out how to add the geom_smooth() line, so it appears as the bars grow upwards. Right now, the line appears just at the end, as seen below.
See below for the current look of the animation.
Here is a simple reprex of my problem:
#Df for reprex
library(ggplot2)
library(tidyverse)year <- as.numeric(c(1996:2002,
1996:2002,
1996:2002))
c <- c(39, 40, 67, 80, 30, 140, 90, 23, 100, 123,
140, 1, 2, 1, 13, 3, 3, 30, 1, 3, 3)
df <- data.frame(year, c) %>%
select(year, c) %>%
arrange(year)#Static plot
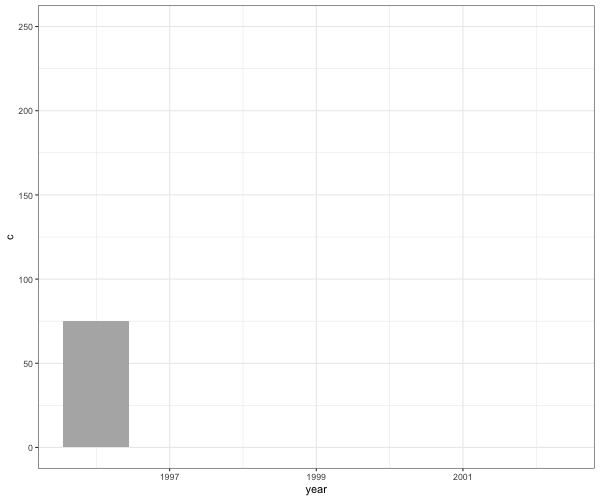
(static_plot <- ggplot(data = df) +
geom_bar(data = df %>% filter(year == 1996), stat="identity", position ="stack",
aes(x = year, y = c)) +
geom_bar(data = df %>% filter(year == 1997), stat="identity", position ="stack",
aes(x = year, y = c)) +
geom_bar(data = df %>% filter(year == 1998), stat="identity", position ="stack",
aes(x = year, y = c)) +
geom_bar(data = df %>% filter(year == 1999), stat="identity", position ="stack",
aes(x = year, y = c)) +
geom_bar(data = df %>% filter(year == 2000), stat="identity", position ="stack",
aes(x = year, y = c)) +
geom_bar(data = df %>% filter(year == 2001), stat="identity", position ="stack",
aes(x = year, y = c)) +
geom_bar(data = df %>% filter(year == 2002), stat="identity", position ="stack",
aes(x = year, y = c)) +
labs(y = "year",
x = "c",
title = "Reprex") +
geom_smooth(df, mapping = aes(x = year, y = c), method = "lm",
colour = "black", se = F)
)#Animation
library(gganimate)
anim <- static_plot +
transition_layers(layer_length = 1, transition_length = 1) +
enter_drift(x_mod = 0, y_mod = -max(df$c))animate(anim, fps = 10, duration = 10,
width = 600, height = 500, renderer =
gifski_renderer())
![[Example of desired appearance of geom_smooth() line]](https://user-images.githubusercontent.com/1775316/49728400-f0ba1b80-fc72-11e8-86c5-71ed84b247db.gif)