Nir's comment means that you have to explicitly add a line for the fitted values in order for it to appear in the plot. For example:
# draw a basic sigmoidal plot
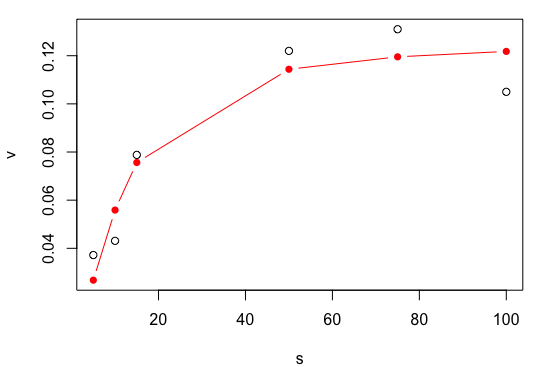
plot(s, v, ylim=range(c(v, predict(sigmoid))))
# Add lines and points for fitted values
lines(s, predict(sigmoid), type="b", pch=16, col="red")
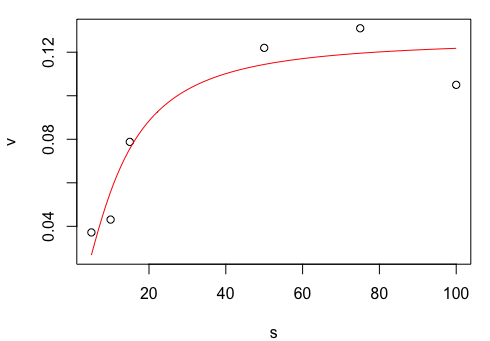
# Add smooth line for fitted values
sp = seq(min(s), max(s), length=100)
vp = predict(sigmoid, newdata=data.frame(s=sp))

plot(s, v, ylim=range(c(v, predict(sigmoid))))
lines(sp, vp, type="l", pch=16, col="red")