I've been trying to get a sigmoidal curve line that goes through/near my data points, so that i can use the sigmoidal fit to find the values of Km and Vmax. Im not sure how to do this. what i have of my code so far is:
s <- c (5, 10, 15, 50, 75, 100)
v <- c (0.0372, 0.0431, 0.0788, 0.122, 0.131, 0.105)
sigmoid <- nls( v ~ Vmax * s^h / ( Km + s^h ) , start = list ( Vmax =0.2, Km =50, h=1))
summary (sigmoid)
# draw a basic sigmoidal plot
plot ( v ∼ s,
       main = "" ,
ylab = " v (umol/min/mg protein) " ,
xlab = " [Ninhydrin Hydrate] (uM)"
)
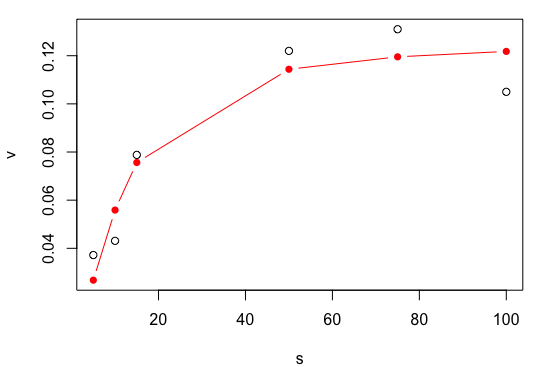
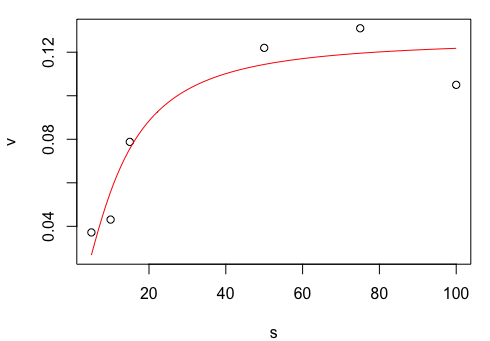
and it produces this graph without a line.However, on the graph i would like a sigmoidal fitting line for the points that would make it look like this roughly (the red line):