Hi
Is there anyway to create a scatter with a line graph but connecting points on the Y-axis rather than X-axis?
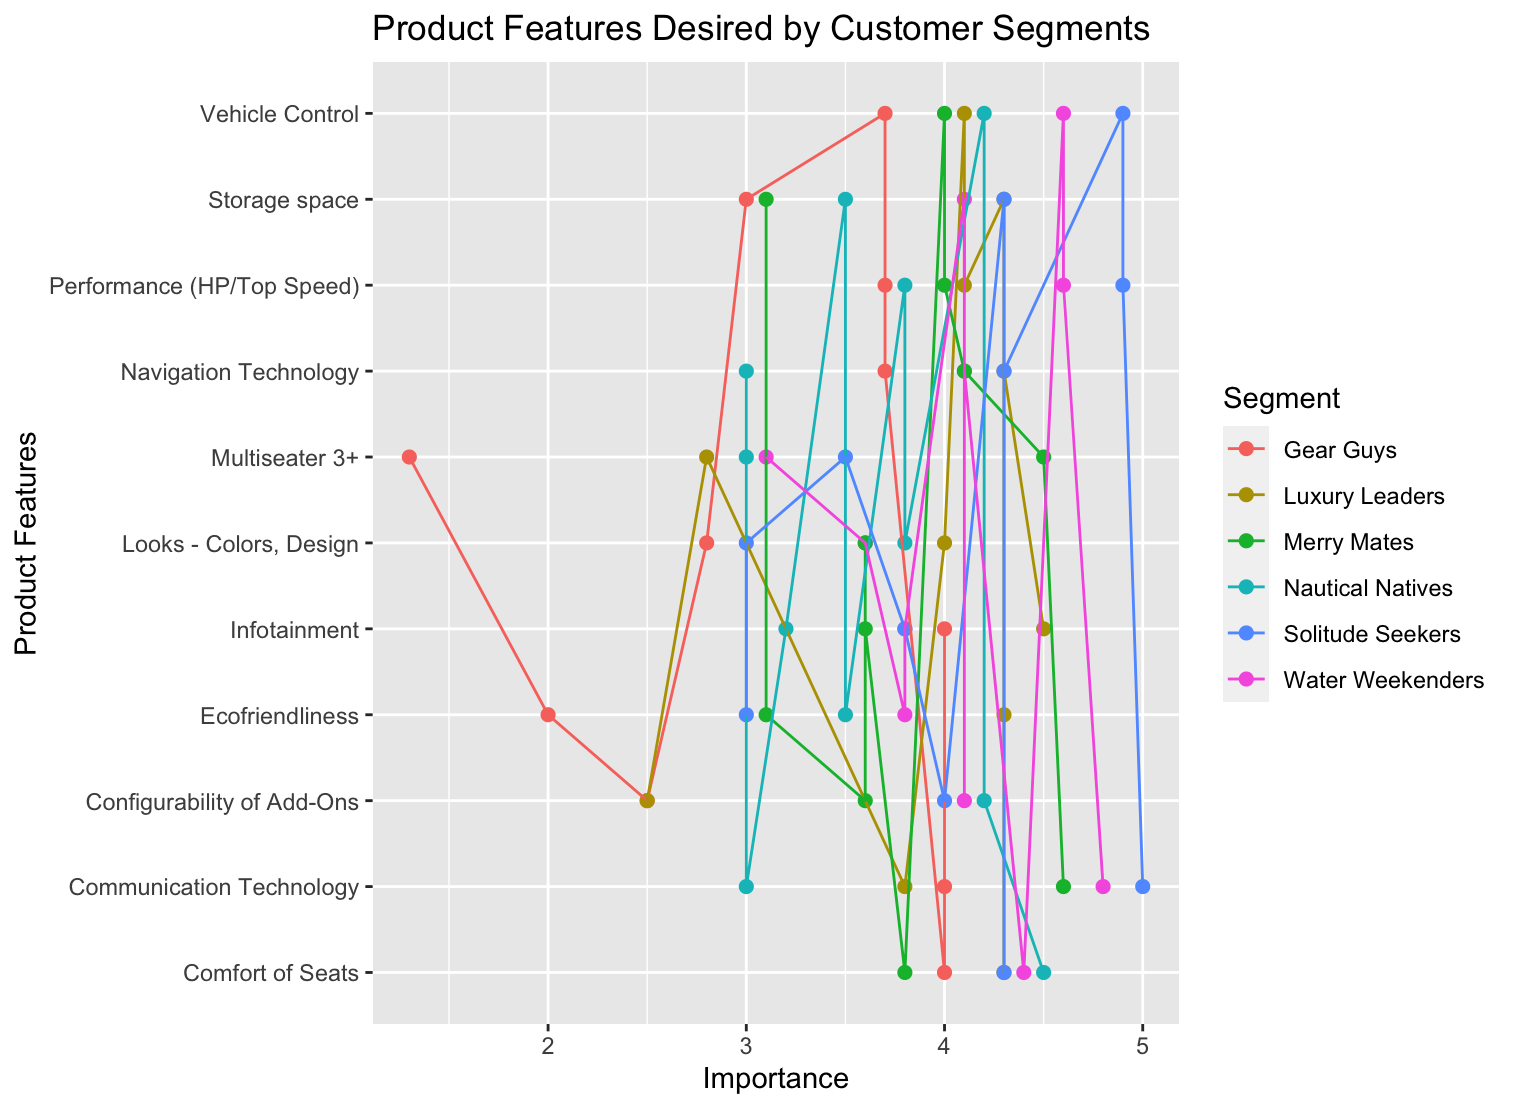
My file Insights only has 3 columns: Criteria (characters), Rating (float) and Segment (char)
My code below produces the chart attached
'''
insight <- read.csv("Insights.csv")
head(insight)
scatter <- ggplot(insight, aes(x = Rating, y = Criteria, color = Segment)) + geom_point(size=2) + labs(title = "Product Features Desired by Customer Segments", x="Importance",y = "Product Features" ) + geom_line(aes(group = Segment))
scatter
'''
1 Like
I get the following line graph which starts from the red point for "Multiseater 3+".
I rather want the subsequent points to be based on the Y-axis. So the red point on "Vehicle Control" should connect next with "Storage Space"
Hi, @harisrup , does it work by add orientation = "y" in geom_line(aes(group = Segment)) like geom_line(aes(group = Segment), orientation = "y")? I mainly refer to the following link. What's more, could you providing a relevant REPRoducible EXample (reprex) for your question?
Connect observations — geom_path • ggplot2 (tidyverse.org)
system
Closed
4
This topic was automatically closed 21 days after the last reply. New replies are no longer allowed.
If you have a query related to it or one of the replies, start a new topic and refer back with a link.