Dear R users,
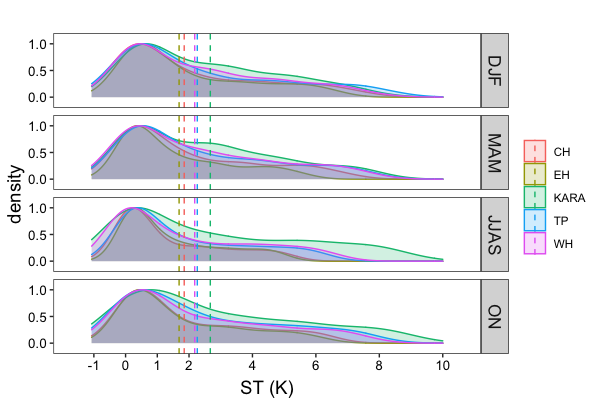
I want to draw mean line of different seasons for each legends. I tried but I could only draw the aggregate mean line for each legends (not seasonally)
my code is
DATA585 %>%
  mutate(season1 = factor(season, levels = c("DJF", "MAM", "JJAS","ON"))) -> DATA585a
ggplot(DATA585a, aes(ST, ..scaled.. , color=region, fill = region))+
  geom_density(alpha=0.2, size=0.5) +
  theme_test() +
  theme(legend.title=element_blank()) +
  theme(axis.title = element_text(face="plain",size=14,color="black"),
        axis.text=element_text(size=10,face="plain", color="black"),
        axis.title.x = element_text(vjust=0.1),
        axis.text.y=element_text(hjust=0.5),
        plot.title = element_text(size=15)) +
  ylab("density") +
  xlab("ST (K)") +
  #xlab(expression(paste("SA (", kg/m^2/d, ")", sep = ""))) +
  labs(title= "") +
  scale_y_continuous(breaks = c(0, 0.5, 1), limits = c(0,1), expand = c(0.1,0.1))+
  scale_x_continuous(breaks = c(-1,0,1,2,4,6,8,10), limits = c(-1.07,10), expand = c(0.1,0.1))+
  facet_grid(season1 ~ .) +
  theme(strip.text.y = element_text(size=13)) ->p

mu <- ddply(DATA585a, "region", summarise, grp.mean=mean(ST))
p + geom_vline(data=mu, aes(xintercept=grp.mean, color=region),
               linetype="dashed")
data can be found Dropbox - File Deleted - Simplify your life
So how could I draw mean line for each legends (area) of different season?