Hi there,
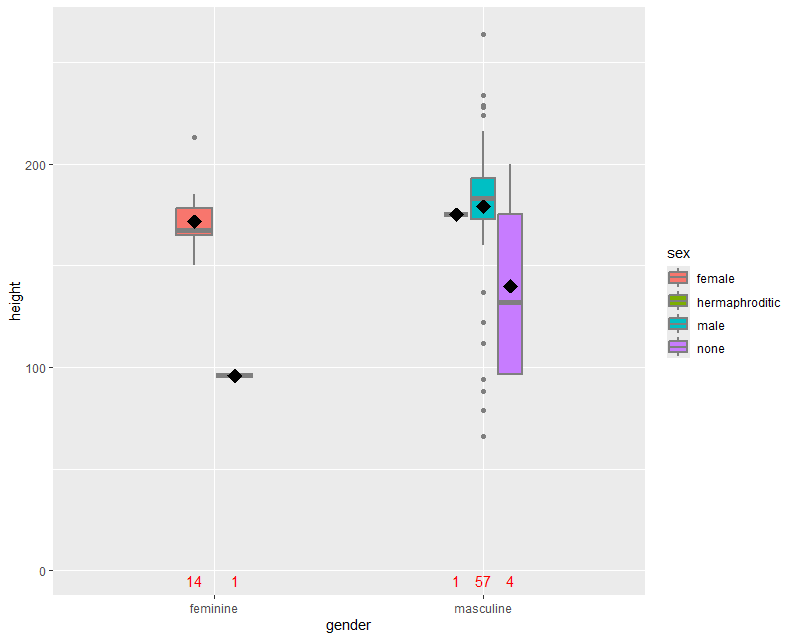
starwars |>
    ggplot()+
     aes(x = gender, y = height, fill = sex)+
     geom_boxplot(width=0.3, size=1, fatten=2, colour="grey50", ) +
    stat_summary(fun = mean, color = "black", position = position_dodge(0.3), geom = "point", shape = 18, size = 5, show.legend = FALSE) +
     geom_text(aes(label=after_stat(count)), stat='count', colour="red", size=4, y = 250) +
     theme_classic()
How to set text below the appropriate boxplots?
In stead of geom_text(), you could use this:
  stat_summary(
    fun.data = function(grouped_height) {
      data.frame(
        y = mean(grouped_height),
        label = length(grouped_height)
      )
    },
    geom = "text",
    colour = "red",
    size = 4,
    vjust = -0.0
  )
mduvekot:
stat_summary(
    fun.data = function(grouped_height) {
      data.frame(
        y = mean(grouped_height),
        label = length(grouped_height)
      )
    },
    geom = "text",
    colour = "red",
    size = 4,
    vjust = -0.0
  )
The problem is, the values, when set to show below boxplots (e.g. y = 1) still are overlayed one over the other...
This works for me:
library(ggplot2)
library(dplyr)
#>
#> Attaching package: 'dplyr'
#> The following objects are masked from 'package:stats':
#>
#>     filter, lag
#> The following objects are masked from 'package:base':
#>
#>     intersect, setdiff, setequal, union

starwars |>
  select(gender, height, sex) |>
  filter(if_all(everything(), ~ !is.na(.))) |>
  ggplot()+
  aes(x = gender, y = height, fill = sex)+
  geom_boxplot(
    width=0.3,
    size=1,
    median.linewidth=2,
    colour="grey50") +
  stat_summary(
    fun = mean,
    color = "black",
    position = position_dodge(0.3),
    geom = "point",
    shape = 18,
    size = 5,
    show.legend = FALSE
  ) +
  stat_summary(
    fun.data = function(grouped_height) {
      data.frame(
        y = mean(grouped_height),
        label = length(grouped_height)
      )
    },
    geom = "text",
    colour = "red",
    size = 4,
    vjust = -0.0
  ) +
  theme_classic()
Created on 2025-08-07 with reprex v2.1.1
1 Like
I have plotted this, but still numbers are on one vertical axis - when you try to put them at the bottom of the fig they are on top of each other (I don't want them at the mean or median's height ).
library(dplyr, quietly = TRUE)
#>
#> Attaching package: 'dplyr'
#> The following objects are masked from 'package:stats':
#>
#>     filter, lag
#> The following objects are masked from 'package:base':
#>
#>     intersect, setdiff, setequal, union
library(ggplot2)

starwars |>
  select(gender, height, sex) |>
  filter(if_all(everything(), ~ !is.na(.))) |>
  ggplot(aes(x = gender, y = height, fill = sex)) +
  geom_boxplot(width = 0.3, size = 1, fatten = 2, colour = "grey50") +
  stat_summary(
    fun = mean,
    geom = "point",
    shape = 18,
    size = 5,
    color = "black",
    # position = position_dodge(0.3),
    show.legend = FALSE
  ) +
  stat_summary(
    fun.data = function(grouped_height) {
      data.frame(
        y = quantile(grouped_height, 0.25, na.rm = TRUE),
        label = length(grouped_height)
      )
    },
    position = position_dodge(.3),
    geom = "text",
    colour = "red",
    size = 4,
    vjust = 1.5
  )
#> Warning: The `fatten` argument of `geom_boxplot()` is deprecated as of ggplot2 4.0.0.
#> ℹ Please use the `median.linewidth` argument instead.
#> This warning is displayed once every 8 hours.
#> Call `lifecycle::last_lifecycle_warnings()` to see where this warning was
#> generated.
Created on 2025-08-08 with reprex v2.1.1
I've done slight corrections and now it works like it should, thanks!
I am posting it below - will have to think/check why it had to be a lambda function there
library(tidyverse)

starwars |>
     select(gender, height, sex) |>
     filter(if_all(everything(), ~ !is.na(.))) |>
     ggplot(aes(x = gender, y = height, fill = sex)) +
     geom_boxplot(width = 0.3, size = 1, fatten = 2, colour = "grey50") +
     stat_summary(
         fun = mean,
         geom = "point",
         shape = 18,
         size = 5,
         color = "black",
         position = position_dodge(0.3),
         show.legend = FALSE
     ) +
     stat_summary(
         fun.data = function(grouped_height) {
             data.frame(
                 y = 1,
                 label = length(grouped_height)
             )
         },
         position = position_dodge(.3),
         geom = "text",
         colour = "red",
         size = 4,
         vjust = 1.5
     )
EDIT: Sorry -meant to mark "solution" under your post @mduvekot , now cannot unmark this...
system
August 15, 2025, 4:20pm
8
This topic was automatically closed 7 days after the last reply. New replies are no longer allowed.