This is a situation where I'd likely make a dataset for plotting the labels that has the faceting variable Art in it along with the axis position info and the labels. Here I create it manually, but sometimes we can do some of the work, like calculate sample size for the labels, via data summaries.
labeldat = data.frame(Art = c("Kormoran", "Loeffler"),
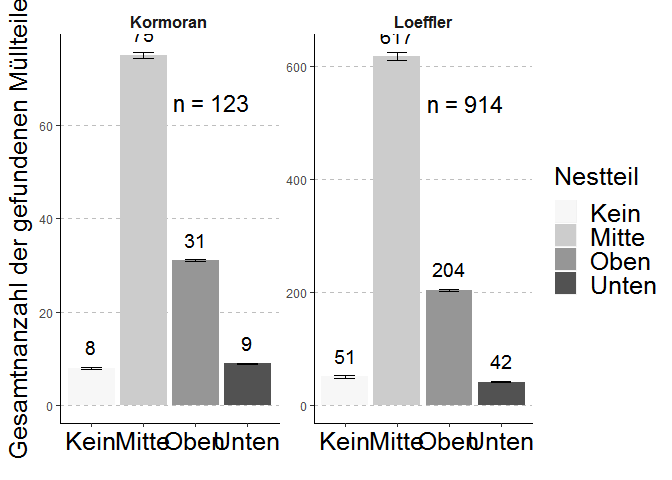
x = c(3.3, 3.3),
y = c(65, 535),
label = c("n = 123", "n = 914") )
Then text for each facet can be added in one geom_text() layer. Note this also gets rid of the issue of overplotting the text that happens when you don't use a new dataset for geom_text() and so the text is printed as many times as there are rows in the original data.
test_plot %>%
    ggplot(aes(x = Nestteil, y = Gesamt, fill = Nestteil))+
    geom_bar(stat = 'identity', position = 'dodge')+
    geom_errorbar(aes( ymin = Gesamt - se, ymax = Gesamt + se ), width = .4)+
    geom_text(aes(label = Gesamt), size = 5,  position = position_dodge(0.8), vjust = -0.9)+
    geom_text(data = labeldat, mapping = aes(x = x, y = y, label = label, fill = NULL), size = 6) +
    scale_fill_brewer(name= 'Nestteil', palette = 'Greys')+
    labs(x ='', y = expression('Gesamtnanzahl der gefundenen Müllteile'))+
    facet_wrap(~Art, scales = 'free')+
    theme(panel.background = element_rect(fill = NA),
          panel.grid.major.y = element_line(color='grey', linetype = 20, size = 0.5),
          axis.line.x = element_line(linetype = 'solid'),
          axis.line.y = element_line(linetype = 'solid'),
          strip.background = element_blank(),
          strip.text = element_text(size = 12, face = 'bold'),
          axis.text.x = element_text(size = 19, family = 'sans', colour = 'black'),
          axis.title.y = element_text(size = 19, family = 'sans', colour = 'black'),
          legend.text = element_text(size = 19,family = 'sans', colour = 'black'),
          legend.title = element_text(size = 19,family = 'sans', colour = 'black'))
Created on 2019-06-20 by the reprex package (v0.2.0).