Hi, here are some code snippets for each of your questions.
library(tidyverse)
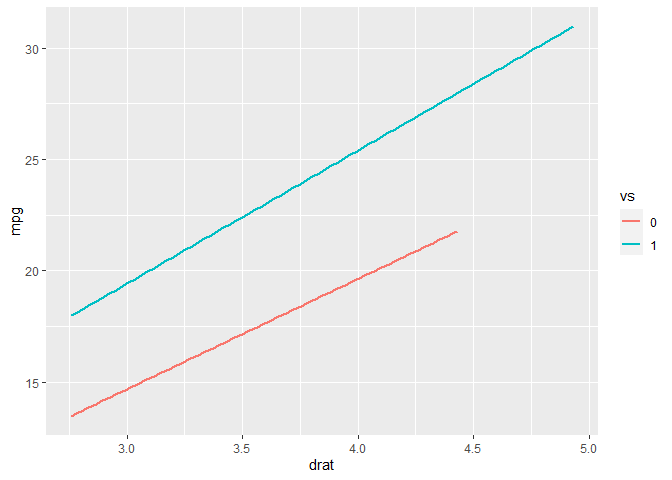
## 1. version without points - sim,ply remove layer with points
ggplot(mtcars,
aes(x = drat, y = mpg,
color = as.factor(vs)
)) +
#stat_summary(fun = 'mean') +
geom_smooth(method = 'lm', se = F) +
labs(color = 'vs')
#> `geom_smooth()` using formula 'y ~ x'
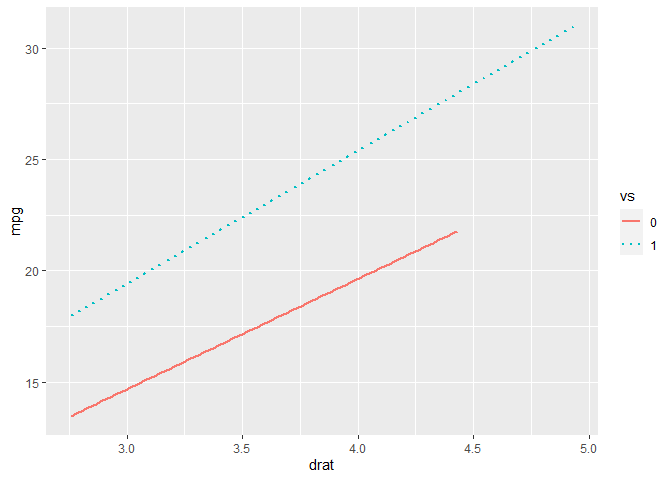
## 2. one line as dotted
ggplot(mtcars,
       aes(x = drat, y = mpg,
           color = as.factor(vs),
           linetype = as.factor(vs)
       )) +
  geom_smooth(method = 'lm', se = F) +
  labs(color = 'vs', linetype = 'vs') +
  scale_linetype_manual(values = c(1, 3))
#> `geom_smooth()` using formula 'y ~ x'
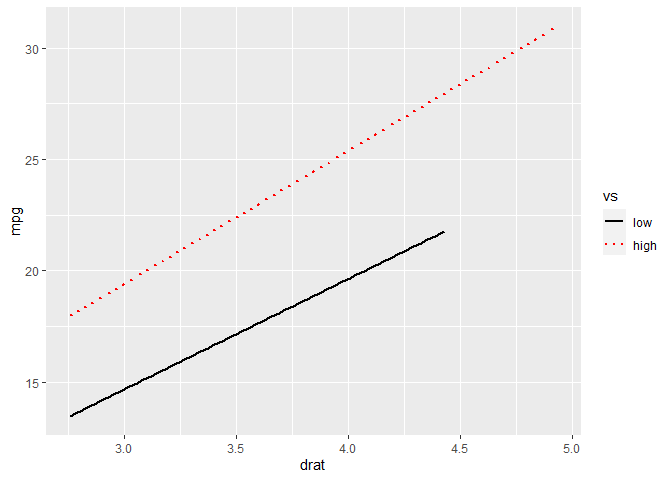
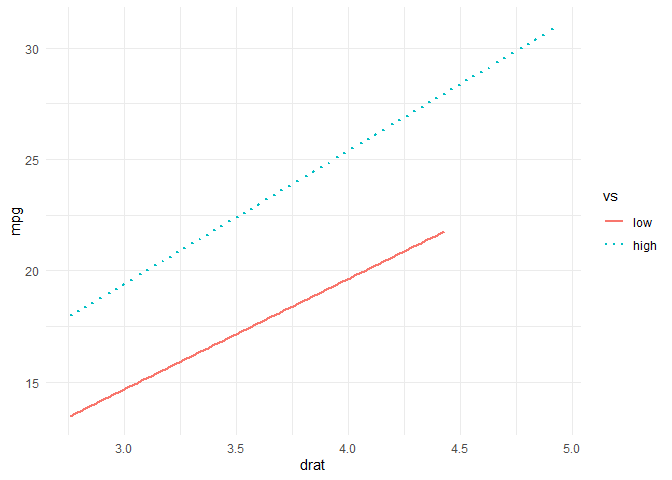
## 3. rename legend key
## simplest way is to create those before handing it to ggplot
mtcars %>%
  mutate(group = if_else(vs == 0, "low", "high")) %>%
  ## to keep same order...
  mutate(group = factor(group, levels = c("low", "high"))) %>%
  ggplot(aes(x = drat, y = mpg,
         color = group,
         linetype = group
    )) +
    geom_smooth(method = 'lm', se = F) +
    labs(color = 'vs', linetype = 'vs') +
    scale_linetype_manual(values = c(1, 3))
#> `geom_smooth()` using formula 'y ~ x'
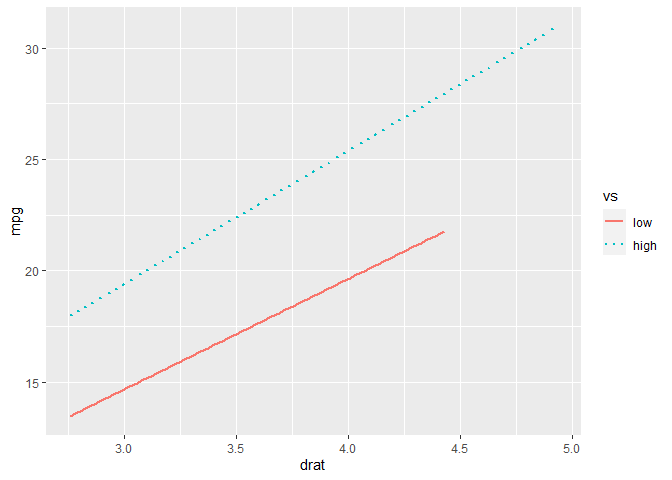
## 4. remove grey background
mtcars %>%
  mutate(
    group = if_else(vs == 0, "low", "high"),
    group = factor(group, levels = c("low", "high"))
  ) %>%
  ggplot(aes(x = drat, y = mpg,
             color = group,
             linetype = group
  )) +
  geom_smooth(method = 'lm', se = F) +
  labs(color = 'vs', linetype = 'vs') +
  scale_linetype_manual(values = c(1, 3)) +
  theme_minimal() ## you can try other themes
#> `geom_smooth()` using formula 'y ~ x'
Created on 2020-07-06 by the reprex package (v0.3.0)
With regard to the last question: Why do you want to do that? What would be the benefit? There is a stat_smooth() function but note that the stat_* and geom_* functions are generally exchangeable.