This question is somewhat similar to this unanswered older question, but I have a reprex.
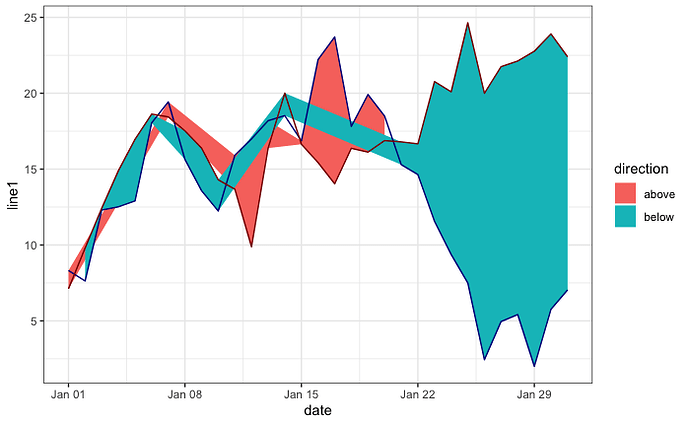
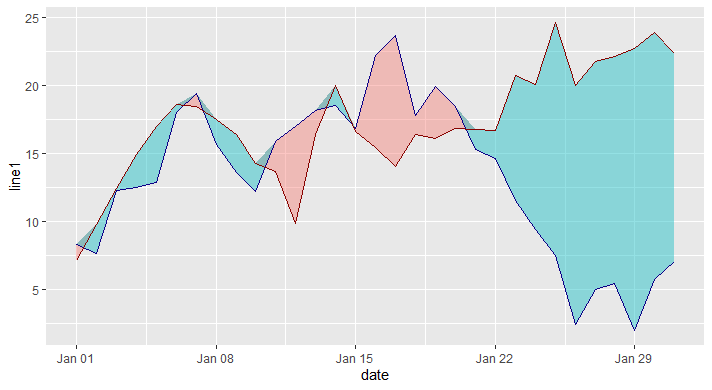
The issue is that when I plot a ribbon using geom_ribbon(), in cases where the upper and lower line meet, you can see that the ribbon colors outside of the lines. The only fix that I can think of is to turn each section of ribbon into a polygon and draw each polygon separately. That is a lot of work for this lazy programmer when there exists a geom_ribbon()!
Interestingly, I tried set.seed(123) first, and that produced a good test data set. None of the several other seeds I tried out of curiosity subsequently did.
library(tidyverse)

set.seed(123)

test_data <- tibble(
  date = as_date(as.numeric(as_date("20240101")):as.numeric(as_date("20240131")))
) |> mutate(
  line1 = 10 + cumsum(rnorm(n=31, mean=0, sd=3)),
  line2 = 8 + cumsum(rnorm(n=31, mean=0, sd=3)),
  lower = pmin(line1, line2),
  upper = pmax(line1, line2),
  direction = if_else(line1>line2, "above", "below")
)

# single fill color
ggplot(test_data, aes(x=date)) +
  geom_ribbon(aes(ymin=lower, ymax=upper), fill="#FF6A6A") +
  geom_line(aes(y=line1), color="darkblue") +
  geom_line(aes(y=line2), color="darkred")

# fill color based on which line is on top
ggplot(test_data, aes(x=date)) +
  geom_ribbon(aes(ymin=lower, ymax=upper, fill=direction)) +
  geom_line(aes(y=line1), color="darkblue") +
  geom_line(aes(y=line2), color="darkred")

# not run because geom_ribbon doesn't support groups, but wouldn't it be nice if it did?
#test_data <- test_data |> mutate(group = cumsum(as.numeric(direction == lag(direction, default="NONE"))))
#ggplot(test_date, aes(x=date)) +
#  geom_ribbon(aes(ymin=lower, ymax=upper, fill=direction, group=group)) +
#  geom_line(aes(y=line1)) +
#  geom_line(aes(y=line2))
Plot with switching fill color. The single fill color plot has the same problem, but it is more obvious here.

