Leon
July 15, 2019, 11:17am
1
Hi all,
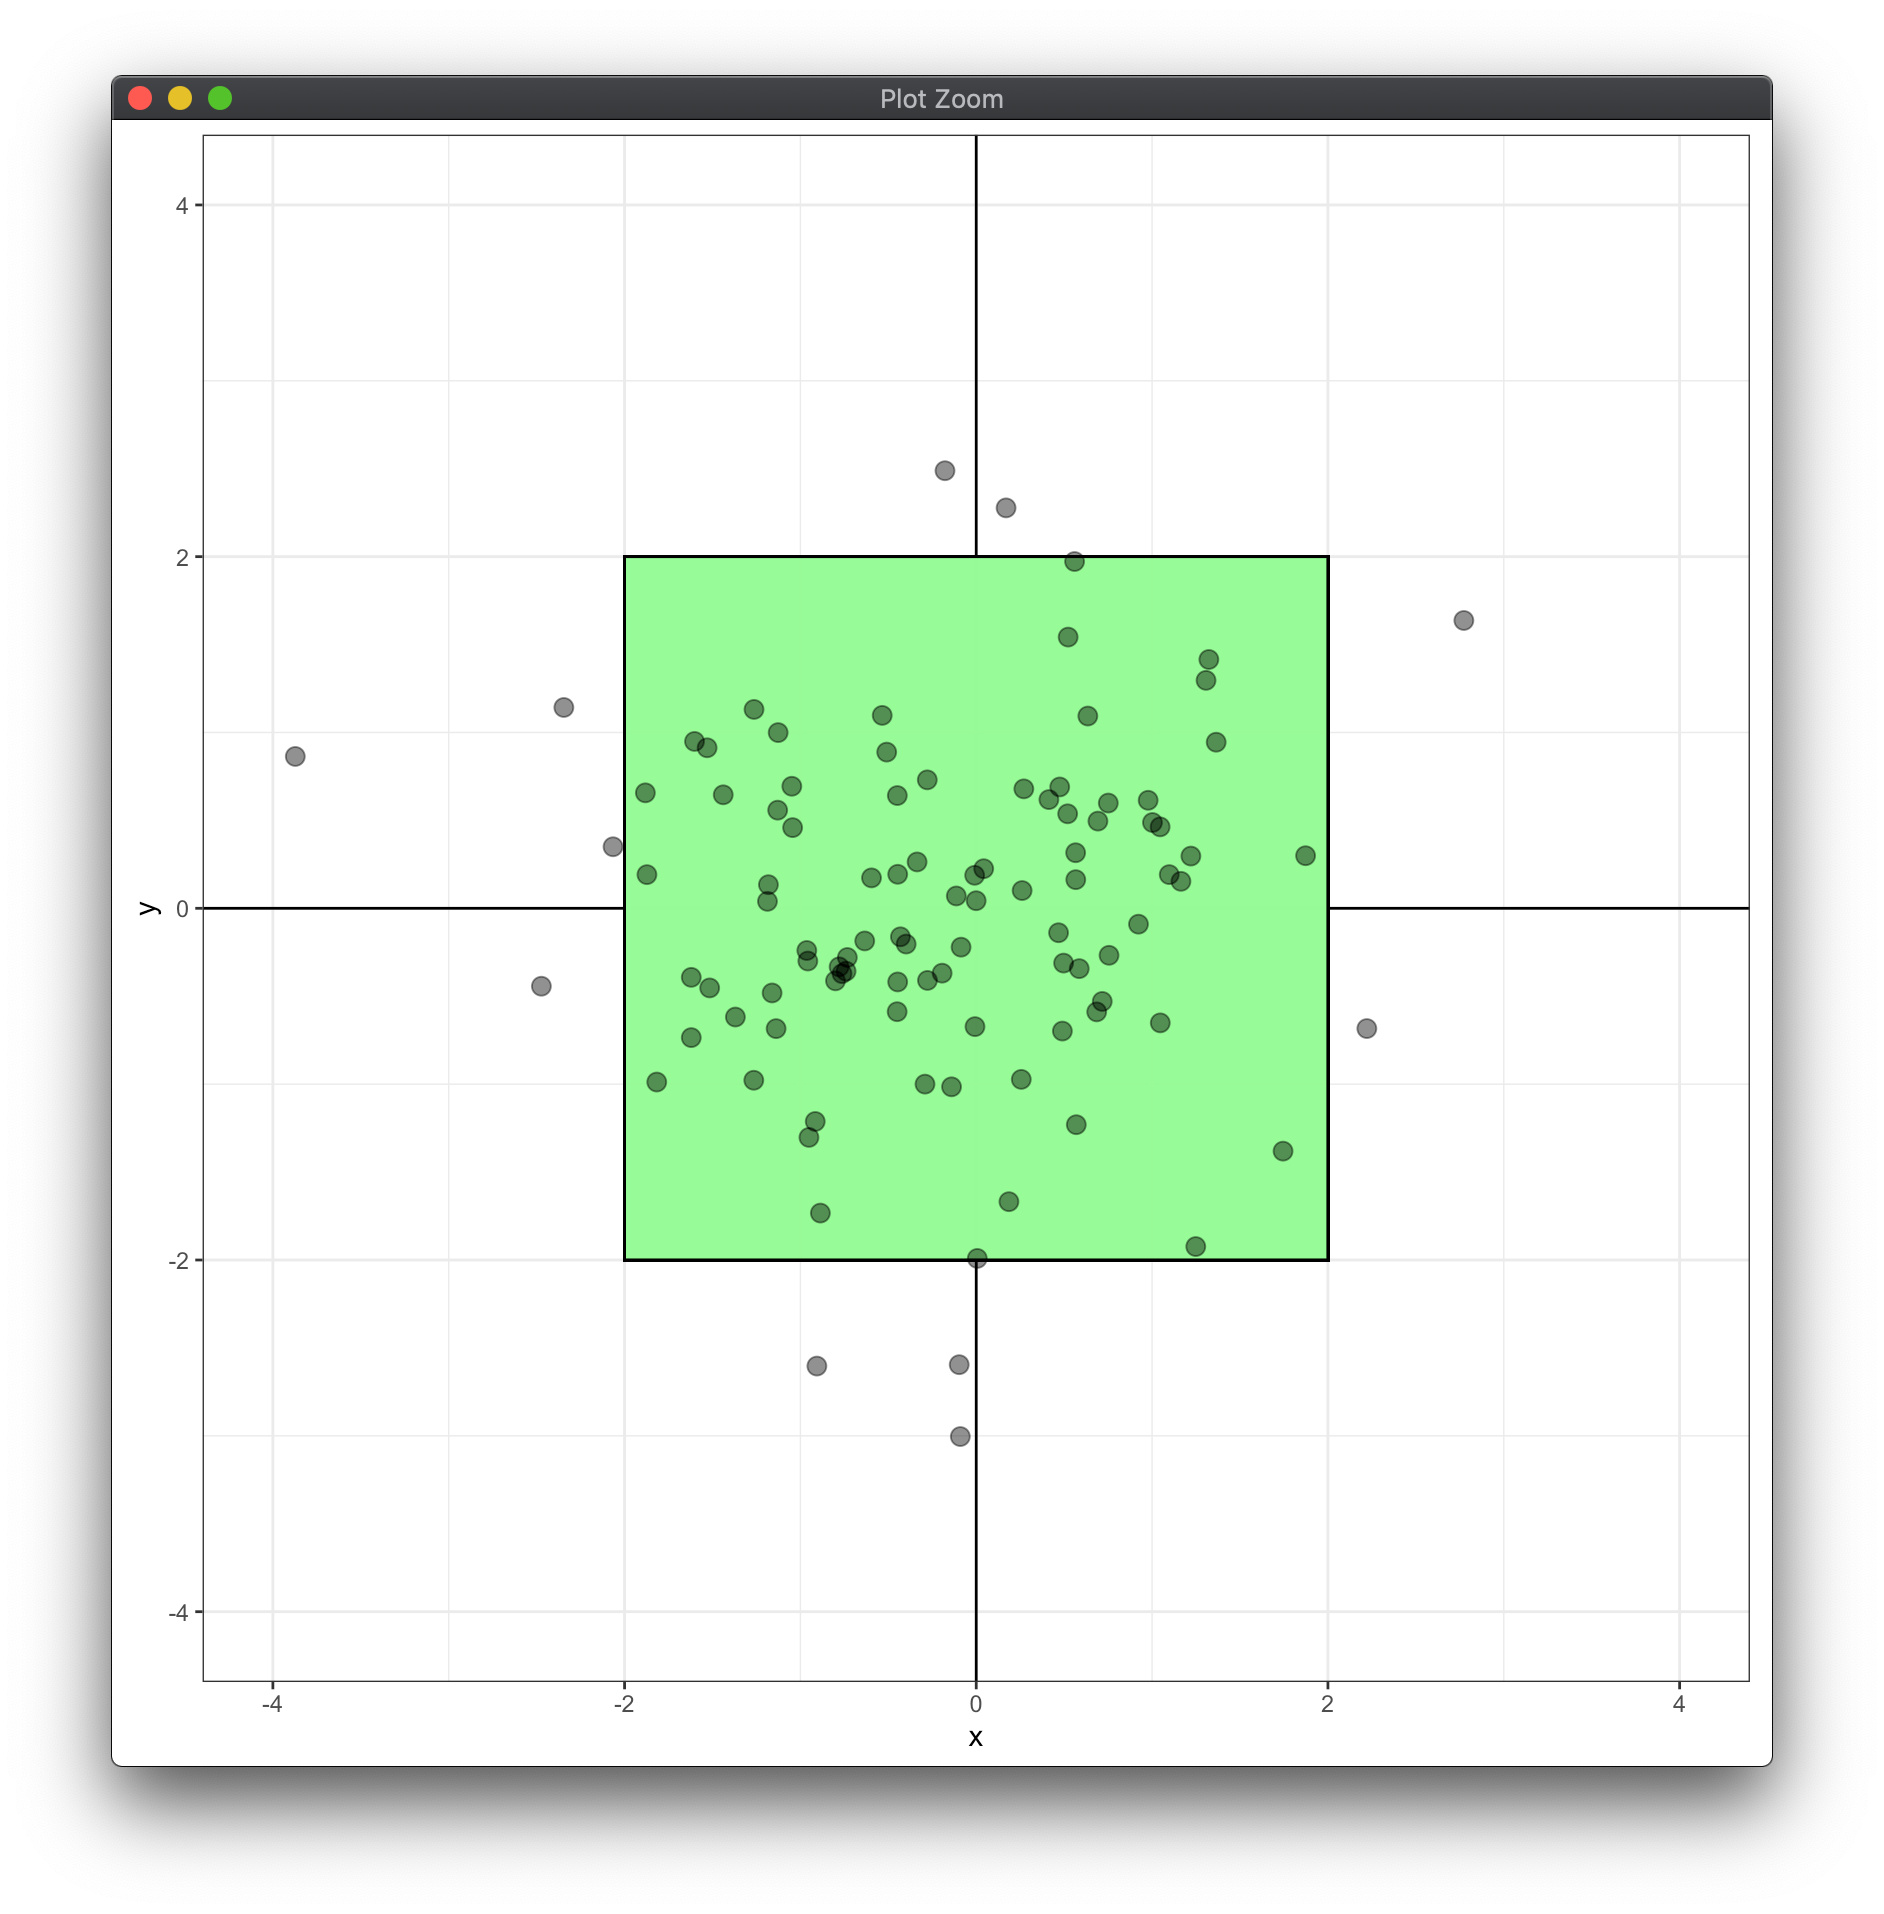
It seems that the geom_rect() function ignores the alpha argument?
Example:
library('tidyverse')
tibble(x = rnorm(100), y = rnorm(100)) %>%
  ggplot(aes(x = x, y = y)) +
  geom_vline(xintercept = 0) +
  geom_hline(yintercept = 0) +
  geom_rect(aes(xmin = -2, xmax = 2, ymin = -2, ymax = 2),
            fill = "palegreen", colour = "black", alpha = 0.5) +
  geom_point(size = 3, alpha = 0.5) +
  theme_bw() +
  coord_fixed(xlim = c(-4, 4), ylim = c(-4, 4))
Yielding:
2 Likes
Hi,
If I set alpha to a really low value, like 0.01, it is working, but for some reason the scale of the value does not match the transparency you'd expect...
Grtz
hadley
July 15, 2019, 12:04pm
3
You are drawing 100 rectangles
2 Likes
Leon
July 15, 2019, 12:20pm
4
I.e. one rectangle per nrow(.)? Wow... How do I avoid this then?
Edit: Tried with inherit.aes = FALSE, but no cigar...
Hi,
Found something that works, but probably not the most elegant solution
library('tidyverse')
tibble(x = rnorm(100), y = rnorm(100)) %>%
  ggplot(aes(x = x, y = y)) +
  geom_vline(xintercept = 0) +
  geom_hline(yintercept = 0) +
  geom_rect(data = data.frame(x = 0, y = 0), aes(xmin = -2, xmax = 2, ymin = -2, ymax = 2),
            fill = "palegreen", colour = "black", alpha = 0.5) +
  geom_point(size = 3, alpha = 0.5) +
  theme_bw() +
  coord_fixed(xlim = c(-4, 4), ylim = c(-4, 4))
PJ
nwerth
July 15, 2019, 1:21pm
6
You can use the annotate function from ggplot2:
tibble(x = rnorm(100), y = rnorm(100)) %>%
  ggplot(aes(x = x, y = y)) +
  geom_vline(xintercept = 0) +
  geom_hline(yintercept = 0) +
  annotate(geom = "rect", xmin = -2, xmax = 2, ymin = -2, ymax = 2,
           fill = "palegreen", colour = "black", alpha = 0.5) +
  geom_point(size = 3, alpha = 0.5) +
  theme_bw() +
  coord_fixed(xlim = c(-4, 4), ylim = c(-4, 4))
9 Likes
Leon
July 15, 2019, 2:25pm
7
Yup, that does the trick - Excellent!
Leon
July 16, 2019, 6:00am
8
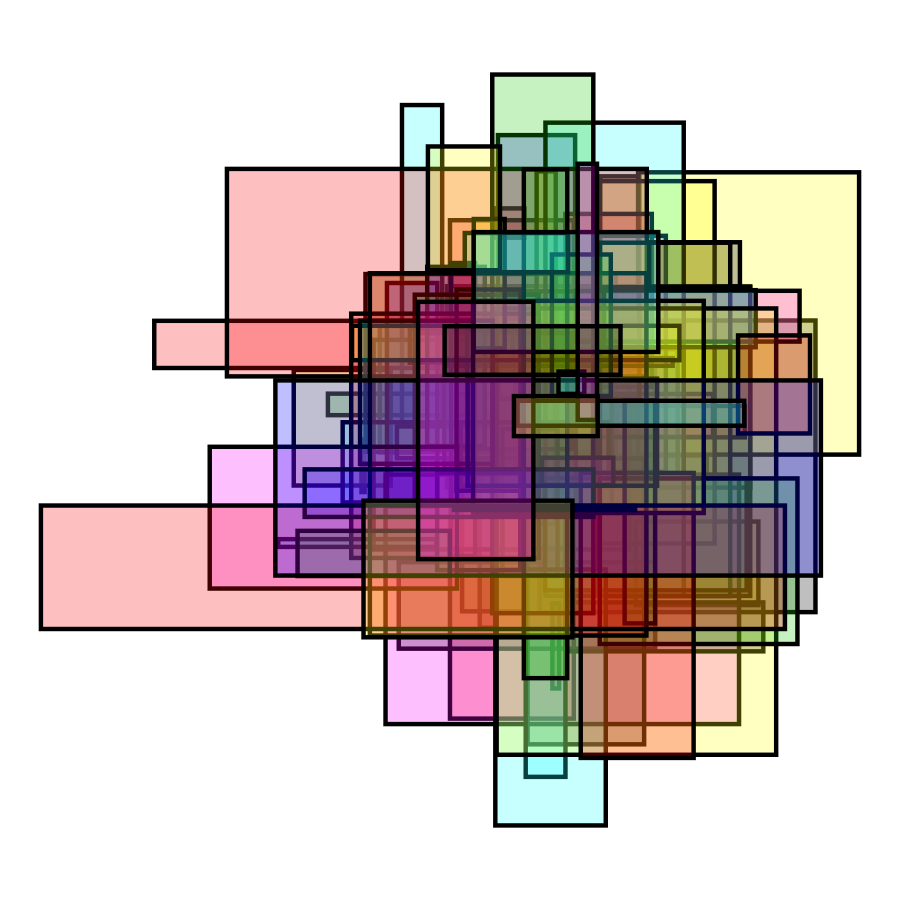
Ps. for future reference: The issue was basically, that I was swapping the intention of the functions, as per @hadley 's hint. geom_rect() is for drawing rectangles and annotate() is for annotating and I wanted to do the latter (The hint is in the title).
Thanks for input
geom_rect() example:
library('ggplot2')
set.seed(75322)
n = 100
tibble(x1 = rnorm(n = n), x2 = rnorm(n = n),
       y1 = rnorm(n = n), y2 = rnorm(n = n)) %>%
  ggplot(aes(xmin = x1, xmax = x2, ymin = y1, ymax = y2)) +
  geom_rect(alpha = 0.25, colour = "black",
            fill = sample(x = 2:7, size = 100, replace = TRUE)) +
  theme_void() +
  coord_fixed()
ggsave(filename = 'my_rectangles.png', width = 3, height = 3)
Yielding:
7 Likes
Leon
July 23, 2019, 2:05pm
10
This topic was automatically closed 7 days after the last reply. New replies are no longer allowed.