Hi people,
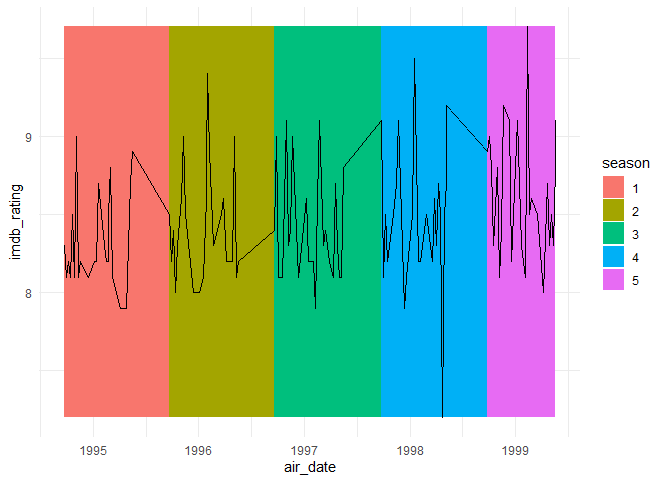
I'm trying to create a plot like this one, with color in the plot background, using the geom_rect:
It cames from this link
My data is like this sample:
dt <- structure(list(season =
                       c(1, 1, 1, 1, 1, 1, 1, 1, 1, 1, 1, 1,
                                1, 1, 1, 1, 1, 1, 1, 1, 1, 1, 1, 1, 2, 2, 2, 2, 2, 2, 2, 2, 2,
                                2, 2, 2, 2, 2, 2, 2, 2, 2, 2, 2, 2, 2, 2, 2, 3, 3, 3, 3, 3, 3,
                                3, 3, 3, 3, 3, 3, 3, 3, 3, 3, 3, 3, 3, 3, 3, 3, 3, 3, 3, 4, 4,
                                4, 4, 4, 4, 4, 4, 4, 4, 4, 4, 4, 4, 4, 4, 4, 4, 4, 4, 4, 4, 4,
                                4, 5, 5, 5, 5, 5, 5, 5, 5, 5, 5, 5, 5, 5, 5, 5, 5, 5, 5, 5, 5,
                                5, 5, 5, 5), episode = c(1, 2, 3, 4, 5, 6, 7, 8, 9, 10, 11, 12,
                                                         13, 14, 15, 16, 17, 18, 19, 20, 21, 22, 23, 24, 1, 2, 3, 4, 5,
                                                         6, 7, 8, 9, 10, 11, 12, 13, 14, 15, 16, 17, 18, 19, 20, 21, 22,
                                                         23, 24, 1, 2, 3, 4, 5, 6, 7, 8, 9, 10, 11, 12, 13, 14, 15, 16,
                                                         17, 18, 19, 20, 21, 22, 23, 24, 25, 1, 2, 3, 4, 5, 6, 7, 8, 9,
                                                         10, 11, 12, 13, 14, 15, 16, 17, 18, 19, 20, 21, 22, 23, 24, 1,
                                                         2, 3, 4, 5, 6, 7, 8, 9, 10, 11, 12, 13, 14, 15, 16, 17, 18, 19,
                                                         20, 21, 22, 23, 24), air_date = structure(c(9030, 9037, 9044,
                                                                                                     9051, 9058, 9065, 9072, 9079, 9086, 9114, 9135, 9142, 9149, 9170,
                                                                                                     9177, 9184, 9184, 9191, 9198, 9226, 9247, 9254, 9261, 9268, 9394,
                                                                                                     9401, 9408, 9415, 9422, 9436, 9443, 9450, 9478, 9499, 9513, 9523,
                                                                                                     9523, 9527, 9534, 9541, 9548, 9576, 9583, 9590, 9611, 9618, 9625,
                                                                                                     9632, 9758, 9765, 9772, 9779, 9786, 9800, 9807, 9814, 9821, 9842,
                                                                                                     9870, 9877, 9891, 9898, 9905, 9912, 9926, 9933, 9947, 9961, 9968,
                                                                                                     9975, 9982, 9989, 9996, 10129, 10136, 10143, 10150, 10164, 10171,
                                                                                                     10178, 10185, 10206, 10213, 10234, 10241, 10255, 10262, 10283,
                                                                                                     10304, 10311, 10318, 10325, 10332, 10339, 10346, 10353, 10353,
                                                                                                     10493, 10500, 10507, 10514, 10528, 10535, 10542, 10549, 10570,
                                                                                                     10577, 10598, 10612, 10626, 10633, 10640, 10647, 10668, 10689,
                                                                                                     10703, 10710, 10717, 10724, 10731, 10731), class = "Date"), imdb_rating = c(8.3,
                                                                                                                                                                                 8.1, 8.2, 8.1, 8.5, 8.1, 9, 8.1, 8.2, 8.1, 8.2, 8.2, 8.7, 8.3,
                                                                                                                                                                                 8.2, 8.2, 8.5, 8.8, 8.1, 7.9, 7.9, 8.3, 8.7, 8.9, 8.5, 8.2, 8.4,
                                                                                                                                                                                 8, 8.3, 8.6, 9, 8.5, 8, 8, 8.1, 8.6, 8.8, 9.4, 8.9, 8.6, 8.3,
                                                                                                                                                                                 8.5, 8.6, 8.2, 8.2, 9, 8.1, 8.2, 8.4, 9, 8.1, 8.1, 8.1, 9.1,
                                                                                                                                                                                 8.3, 8.4, 9, 8.1, 8.6, 8.2, 8.2, 7.9, 8.6, 9.1, 8.3, 8.4, 8.2,
                                                                                                                                                                                 8.1, 8.7, 8.3, 8.1, 8.1, 8.8, 9.1, 8.1, 8.5, 8.2, 8.4, 8.5, 8.7,
                                                                                                                                                                                 9.1, 7.9, 8.1, 8.5, 9.5, 8.2, 8.2, 8.5, 8.2, 8.6, 8.3, 8.7, 8.5,
                                                                                                                                                                                 7.2, 8.5, 8.7, 9.2, 8.9, 9, 8.8, 8.3, 8.8, 8.1, 8.4, 9.2, 9.1,
                                                                                                                                                                                 8.2, 9.1, 8.3, 8.1, 9.7, 8.5, 8.6, 8.5, 8, 8.7, 8.3, 8.5, 8.3,
                                                                                                                                                                                 8.8, 9.1)), row.names = c(NA, -121L), class = c("tbl_df", "tbl",
                                                                                                                                                                                                                                 "data.frame"))
And I've tried this code:
library(tidyverse)

dt %>%
  arrange(season, episode) %>%
  group_by(season) %>%
  mutate(Xmin = min(air_date),
         Xmax = max(air_date))%>%
  ungroup() %>%
  mutate(season = as.factor(season)) %>%
  ggplot(aes(air_date, y = imdb_rating))+
  geom_rect(aes(xmin = Xmin,
                xmax = Xmax,
                ymin = Inf,
                ymax = Inf,
                fill = season))+
  theme_minimal()
Would anyone have any tips on how I could do this? Thanks in advantage