geom_path: Each group consists of only one observation. Do you need to adjust the group aesthetic? error for Boxplot and geom_line

Hi,

I'm trying to create a Boxplot with lines between dots of 2 conditions (PRE & POS) from an excel table. However, in this excel table, some rows are empty (cause of lack of data). I guess this is posing a problem for establishing my lines between my 2 conditions. Here is the script I used (working when I have fully filled excel rows):

data<-read_excel("Thelper PRE POS.xls")
Samples<-data$samples
Samples=as.factor(data$samples)
Samples
Th1<-data$Th1
condi<-data$condi
Condi=as.factor(data$condi)
Condi<-factor(c("pre","pos"))
dfdata<-data.frame(condi,Th1)

dfdata<-drop_na(dfdata)

p<-ggplot(dfdata,aes(x=reorder(condi,Th1),y=Th1))+
geom_boxplot(aes(fill=condi),width=0.4, size=1,fatten=0.3,colour="black")+
geom_point(size=2, colour="black")+
geom_line(aes(group=Samples),colour="grey",linetype="11")+
scale_fill_manual(values = c("#C3D7A4", "#CC79A7"))+
theme_classic()
p

Here is the error I get:
geom_path: Each group consists of only one observation. Do you need to adjust the group
aesthetic?

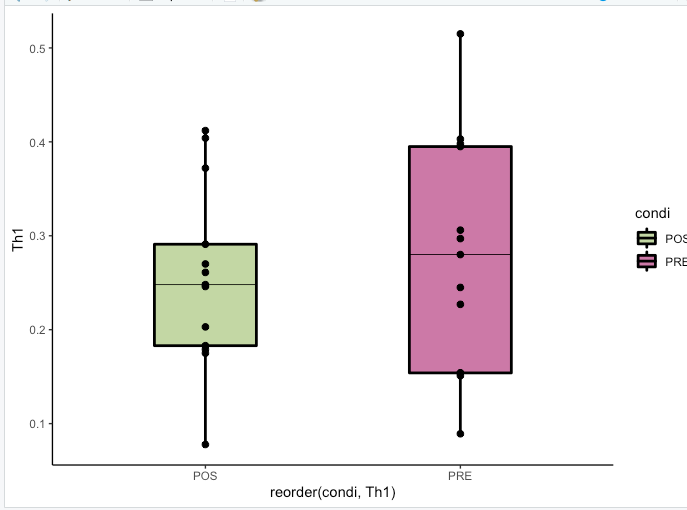
And lines are not present on my graphs:

What can be the problem?

Thanks a lot

Hi!

To help us help you, could you please prepare a reproducible example (reprex) illustrating your issue? Please have a look at this guide, to see how to create one:


Short Version

You can share your data in a forum friendly way by passing the data to share to the dput() function.
If your data is too large you can use standard methods to reduce it before sending to dput().
When you come to share the dput() text that represents your data, please be sure to format your post with triple backticks on the line before your code begins to format it appropriately.

```
( example_df <- structure(list(Sepal.Length = c(5.1, 4.9, 4.7, 4.6, 5, 5.4, 4.6, 
5, 4.4, 4.9), Sepal.Width = c(3.5, 3, 3.2, 3.1, 3.6, 3.9, 3.4, 
3.4, 2.9, 3.1), Petal.Length = c(1.4, 1.4, 1.3, 1.5, 1.4, 1.7, 
1.4, 1.5, 1.4, 1.5), Petal.Width = c(0.2, 0.2, 0.2, 0.2, 0.2, 
0.4, 0.3, 0.2, 0.2, 0.1), Species = structure(c(1L, 1L, 1L, 1L, 
1L, 1L, 1L, 1L, 1L, 1L), .Label = c("setosa", "versicolor", "virginica"
), class = "factor")), row.names = c(NA, -10L), class = c("tbl_df", 
"tbl", "data.frame")))
```

This topic was automatically closed 21 days after the last reply. New replies are no longer allowed.

If you have a query related to it or one of the replies, start a new topic and refer back with a link.