Hi,
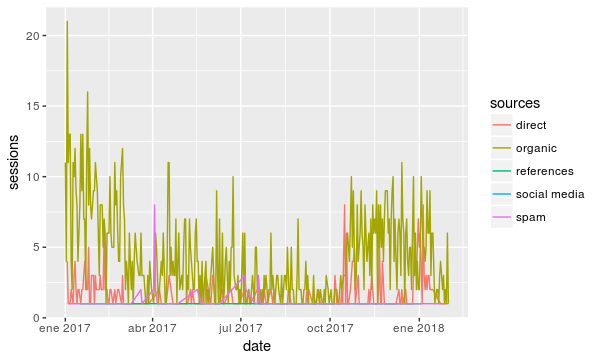
I need a way to highlight all my visits from source "organic". I think I can have 2 geom_lines:
- One with all the data.
- Only the organic data.
But I don't know exactly how my code shoud be written.
This is how I would tipycally would show all data:
ggplot(data_line, aes(date, sessions, color=sources)) +
  geom_line()
How can I only highlight "organic" source?
I'm putting a str result and not a dput as my data is a little big.
str(data_line)
Classes ‘grouped_df’, ‘tbl_df’, ‘tbl’ and 'data.frame':	612 obs. of  3 variables:
 $ date    : Date, format: "2017-01-01" "2017-01-02" ...
 $ sources : chr  "organic" "organic" "direct" "organic" ...
 $ sessions: num  11 4 4 21 1 11 13 1 1 13 ...
 - attr(*, "vars")= chr "date"
 - attr(*, "drop")= logi TRUE
Thank you.
You could try the gghighlight package available on CRAN. There is a nice webpage vignette: https://yutani.rbind.io/post/2017-10-06-gghighlight/.
You could also generate 2 data frames (one with organic only and one with the other sources) and plot both data frames using separate geom_line() calls.
e.g. something like this
library(dplyr) #includes the starwars dataset
library(ggplot2)

homeworld_tatooine <- starwars %>%
  select(height, mass, homeworld) %>%
  filter(homeworld == "Tatooine", !is.na(mass))

homeworld_other <- starwars %>%
  select(height, mass, homeworld) %>%
  filter(homeworld != "Tatooine", !is.na(mass))

ggplot() +
  geom_line(data = homeworld_tatooine, aes(mass, height), colour="red") +
  geom_line(data = homeworld_other, aes(mass, height), colour = "grey40") +
  theme_minimal()
I hope this is helpful.
5 Likes
Thank you, Steph. Exactly what I was looking for. 
1 Like