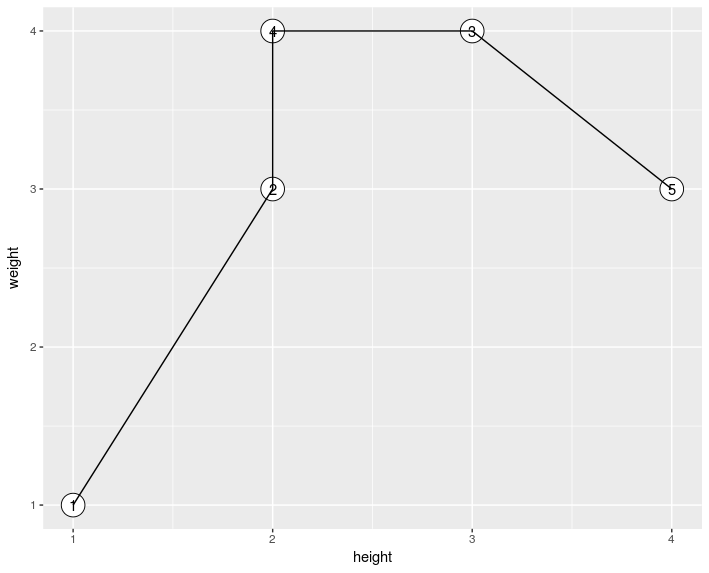
geom_line connects points in order from the lowest the x value to the highest. If an x value is repeated, the repeated values are kept (relative to each other) in the order they appear in the data.
To connect all points in the order they appear in the data, use geom_path.
geom_text isn't following a path. It's plotting a label at each (h, w) location in the data. If the label comes from the data, that is, a data column is mapped to the label aesthetic, which would be the typical case, then the label always corresponds to the appropriate (h,w) value. However, if the label values are hardcoded outside of aes, as in your example, then the labels will be plotted in the hardcoded order, which, in general, will be different than the sorted order of the x values, unless the data frame is already sorted by the x values before plotting. The advantage of using aesthetic mappings is that they intrinsically maintain the appropriate correspondences between all the data values.
Below are a few examples where we include both geom_point and geom_path.
library(tidyverse)
theme_set(theme_classic())

d=data.frame(height=c(1,2,2,3,4), weight=c(1,3,4,4,3))
d2=data_frame(h=c(1,2,3,2,4), w=c(1,3,4,4,3),
              labs=paste0(h,c("","a","","b","")))
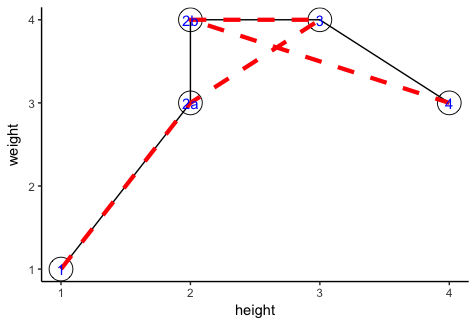
First, we'll plot the data with the labs column mapped to the label aesthetic.
ggplot(d2, aes(h, w)) +
  geom_point(data=d, aes(x=height, y=weight), size=8, shape=21, fill='white') +
  geom_line() +
  geom_path(colour="red", linetype=2, size=1.5) +
  geom_text(aes(label=labs), colour="blue")
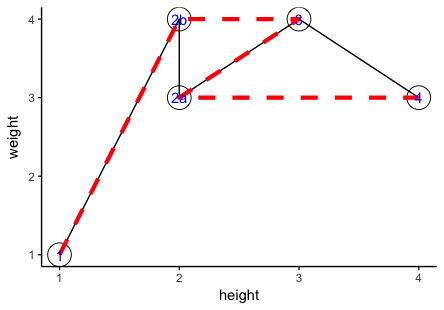
Now let's hardcode the label values outside of aes:
ggplot(d2, aes(h, w)) +
  geom_point(data=d, aes(x=height, y=weight), size=8, shape=21, fill='white') +
  geom_line() +
  geom_path(colour="red", linetype=2, size=1.5) +
  geom_text(colour="blue", label=c(1,"2b",3,"2a",5))
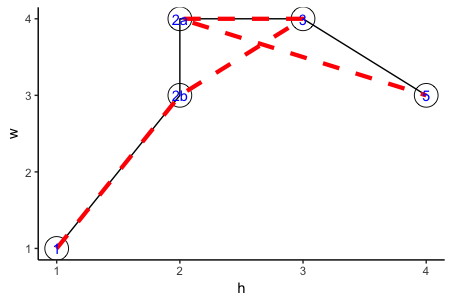
Finally, let's modify the data frame by switching the order of the points with height=2, without changing the order of any other rows:
d2 = d2[c(1,4,3,2,5), ]

ggplot(d2, aes(h, w)) +
  geom_point(data=d, aes(x=height, y=weight), size=8, shape=21, fill='white') +
  geom_line() +
  geom_path(colour="red", linetype=2, size=1.5) +
  geom_text(aes(label=labs), colour="blue")