Screenshots are disfavored to illustrate the problem, use a reprex. See the FAQ.
There should have been an error message
Do you need to adjust the group aesthetic
eventually leading to
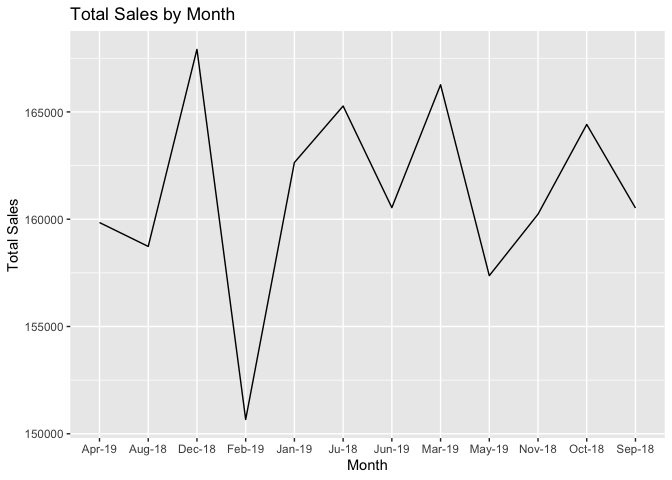
library(ggplot2)

total_sales_by_month_year <- data.frame(
  date = c(
    "Ju-18", "Aug-18", "Sep-18",
    "Oct-18", "Nov-18", "Dec-18", "Jan-19", "Feb-19", "Mar-19",
    "Apr-19", "May-19", "Jun-19"
  ),
  tot_amount = c(
    165275, 158731, 160522,
    164416, 160234, 167913, 162642, 150665, 166265, 159845,
    157368, 160539
  )
)

ggplot(data = total_sales_by_month_year, aes(x = date, y = tot_amount, group = 1)) +
  geom_line() +
  labs(title = "Total Sales by Month", x = "Month", y = "Total Sales")
Created on 2023-03-31 with reprex v2.0.2
but it is something that seems to trip up everyone when they see it.