Hey ,
I got a matrix/table of ca. 200 rows.
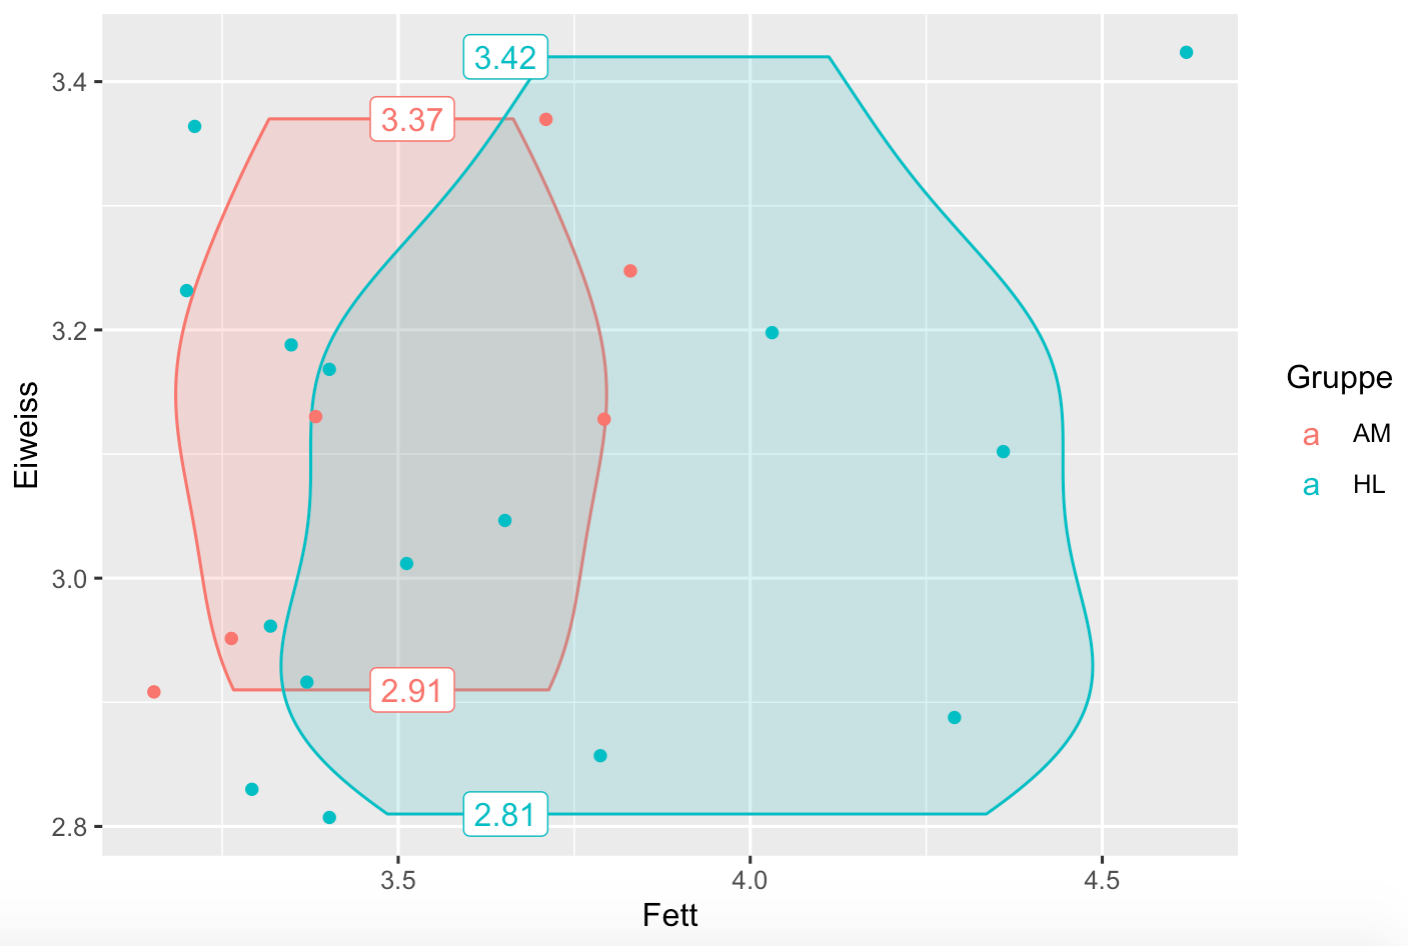
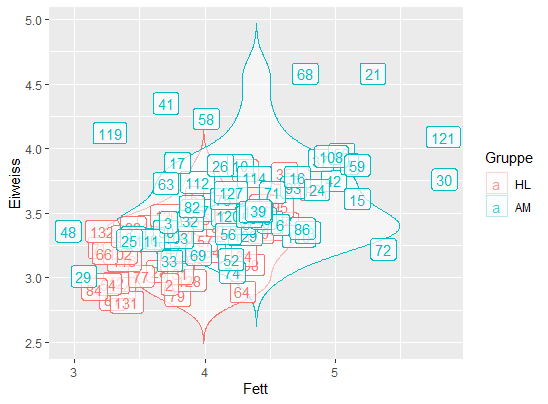
By plotting all I want to show min and max of the data by geom-label (all data>=1.35 and <= 1.05) but also all the other as geom_point.
Is ther a possibility?
datastructur:
H N L Md Mg Fett Eiweiss Hst F_E Ener Gruppe
1 96 3 8 20 34.8 4.62 3.42 260 1.3508772 37.386659 HL
2 64 3 4 22 32.9 4.29 2.89 112 1.4844291 32.971216 HL
3 104 3 4 22 37.5 4.03 3.20 146 1.2593750 37.195884 HL
4 79 4 2 36 37.3 3.79 2.86 175 1.3251748 35.148427 HL
5 81 3 5 38 31.8 3.29 2.83 88 1.1625442 28.062530 HL
6 94 3 3 38 50.6 3.37 2.92 159 1.1541096 45.413500 HL
7 28 3 4 50 40.7 3.65 3.05 229 1.1967213 38.187271 HL
8 131 3 4 50 43.7 3.40 2.81 152 1.2099644 39.064869 HL
9 12 3 3 51 40.0 3.32 2.96 156 1.1216216 35.770732 HL
10 77 3 3 51 56.0 3.51 3.01 170 1.1661130 51.490976 HL
11 8 3 8 52 45.3 3.40 3.17 165 1.0725552 41.539271 HL
12 73 3 7 52 37.0 3.20 3.23 135 0.9907121 33.213140 HL
13 100 3 2 63 35.1 3.79 3.13 146 1.2108626 33.682088 AM
14 116 3 2 63 39.1 3.38 3.13 180 1.0798722 35.663253 AM
15 54 3 4 64 38.2 3.26 2.95 191 1.1050847 33.871055 AM
16 98 3 6 83 33.3 4.36 3.10 167 1.4064516 34.089860 HL
17 84 3 4 84 44.4 3.15 2.91 138 1.0824742 38.688915 AM
18 102 3 8 100 44.3 3.35 3.19 222 1.0501567 40.422399 HL
19 90 3 2 102 34.8 3.71 3.37 141 1.1008902 33.606402 AM
20 130 3 5 102 39.9 3.83 3.25 159 1.1784615 38.779637 AM
21 132 3 1 109 34.6 3.21 3.36 173 0.9553571 31.386841 HL
I hope somebody can help. I tryed it for hours now ![]()
data is incomplete...... so may "(all data>=1.35 and <= 1.05)" differs. In the end there gonna be values for that rule.