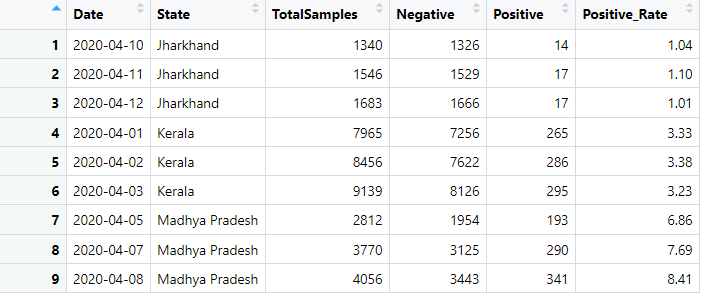
I have a dataset that have the data for multiple states of India and the rate (percentage) of covid-19 positive reported cases for numerous dates. I want to use an India's state divided map to visualize the percentage of each state through a color (dark red if the percentage is higher, lighter red if its lower).
I understand that I need a shape data file for the coordinates (longitude/latitude) for Indian states so that I can merge that dataset with my covid-19 positive rate dataset and use a date filter in Shiny R App to make it interactive. I am struggling with finding the shape file. Has anyone worked on geo spatial data or have any idea how can I achieve my goal. I need suggestion for the format of shape file which I should be using. Or any recommendation for the approach would highly be welcomed.
I've attached a sample of my dataset for your reference.
