geo spatial data

Hi!

I have a data set with state abbreviations that I am trying to link to some type of geospatial data that can be represented by the leaflet package. I found the usmap package and can link that to my data table but the provided x, y coordinates that originally seemed to be latitude and longitude, have values that do not coincide with lat and lng. See below:

library(usmap)
us_map()

I am wondering:

  1. what am I missing with respect to those values?
  2. Is there another way to link geospatial data to a data table with state abbreviations for use in leaflet.

Cheers,
M

  1. Check the projection, it may be in meters
  2. tidycensus has sf files with state polygons
1 Like

Interesting. Good ideas.

  1. The x and y coordinates from us_map seem to be in Albers
    Equal Area projection, which I don't know how to get the addPolygons of leaflet to accept, also still looking for a way to convert the Albers projection back to lat and lng.

  2. tidycensus is interesting but it seems to be associated with a census key and other variables, I am looking for lat and lng to link to state names.

# devtools::install_github("UrbanInstitute/urbnmapr")
library(ggplot2)
library(urbnmapr)
states_sf <- get_urbn_map(map = "states", sf = TRUE)

states_sf  |>
  ggplot() +
  geom_sf(aes(), 
          fill = "grey", color = "#ffffff", size = 0.25) +
  geom_sf_text(data = get_urbn_labels(map = "states", sf = TRUE), 
               aes(label = state_abbv), 
               size = 3)
#> old-style crs object detected; please recreate object with a recent sf::st_crs()

Created on 2023-05-02 with reprex v2.0.2

1 Like

^Cool.
I was able to link my data to us_states from the spData package but the geospatial data for Hawaii and Alaska is not linking. There are individual files for these states but they do not merge with us_states throwing the Error: "arguments have different crs".


library(sf)
library(sp)
library(spData)

state<- us_states
Hi <- hawaii
Ak <- alaska

rbind(state, Hi)

Clearly I am still confused and perhaps too confused to ask an articulate question. I will keep poking around and trying things. Thank you for the help!

Cheers,
M

1 Like

There’s a snippet somewhere to do AK HI snippets with compatible projections. I’ll see if I can find

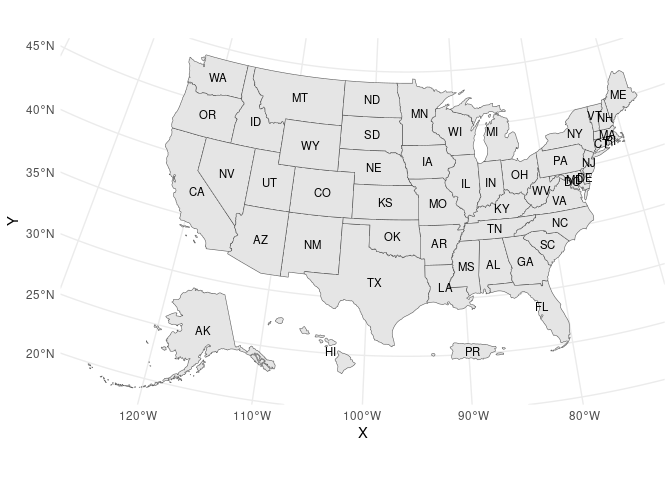
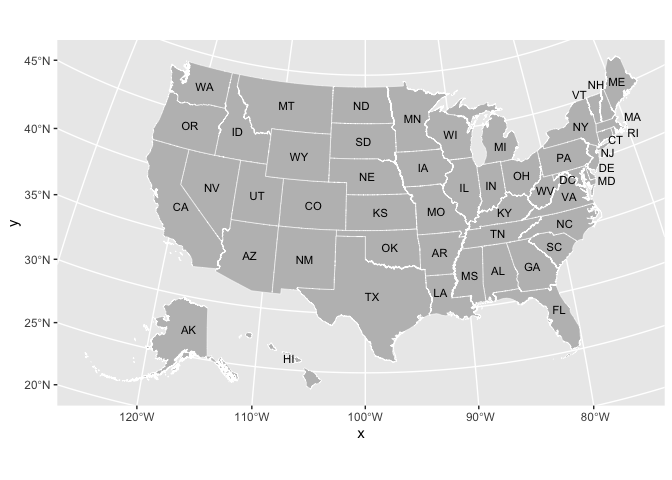
This needs some touchup to nudge a few state names, callouts on the smaller states lose the axis names and long/lat grid.

library(ggplot2)
library(sf)
#> Linking to GEOS 3.10.2, GDAL 3.4.1, PROJ 8.2.1; sf_use_s2() is TRUE
library(tidycensus)
library(tigris)
#> To enable caching of data, set `options(tigris_use_cache = TRUE)`
#> in your R script or .Rprofile.
options(tigris_use_cache = TRUE)
basemap <- get_acs(
  geography = "state",
  variables = "B01002_001",
  year = 2019,
  survey = "acs1",
  geometry = TRUE,
  resolution = "20m",
  cache_table = TRUE
) |> shift_geometry()
#> Getting data from the 2019 1-year ACS
#> The 1-year ACS provides data for geographies with populations of 65,000 and greater.
basemap <- basemap[c(1, 2, 6)]
converter <- data.frame(
  NAME = c(
    "Alabama", "Alaska", "Arizona", "Arkansas",
    "California", "Colorado", "Connecticut", "Delaware",
    "District of Columbia", "Florida", "Georgia", "Hawaii",
    "Idaho", "Illinois", "Indiana", "Iowa",
    "Kansas", "Kentucky", "Louisiana", "Maine",
    "Maryland", "Massachusetts", "Michigan",
    "Minnesota", "Mississippi", "Missouri", "Montana",
    "Nebraska", "Nevada", "New Hampshire", "New Jersey",
    "New Mexico", "New York", "North Carolina", "North Dakota",
    "Ohio", "Oklahoma", "Oregon", "Pennsylvania", "Puerto Rico",
    "Rhode Island", "South Carolina", "South Dakota", "Tennessee",
    "Texas", "Utah", "Vermont", "Virginia",
    "Washington", "West Virginia", "Wisconsin", "Wyoming"
  ),
  ABBR = c(
    "AL", "AK", "AZ", "AR", "CA", "CO", "CT", "DE", "DC",
    "FL", "GA", "HI", "ID", "IL", "IN", "IA", "KS", "KY", "LA",
    "ME", "MD", "MA", "MI", "MN", "MS", "MO", "MT", "NE", "NV",
    "NH", "NJ", "NM", "NY", "NC", "ND", "OH", "OK", "OR", "PA",
    "PR", "RI", "SC", "SD", "TN", "TX", "UT", "VT", "VA", "WA",
    "WV", "WI", "WY"
  )
)

basemap <- dplyr::left_join(basemap, converter)
#> Joining with `by = join_by(NAME)`
abbr_loc <- st_coordinates(st_centroid(basemap$geometry))
basemap <- cbind(basemap, abbr_loc)

ggplot(basemap) +
  geom_sf(data = basemap) +
  geom_text(aes(X, Y, label = ABBR), size = 3) +
  theme_minimal()

This topic was automatically closed 42 days after the last reply. New replies are no longer allowed.

If you have a query related to it or one of the replies, start a new topic and refer back with a link.