Hi all,
I'm happy to share that geneviewer 0.2.0 is now on CRAN. geneviewer is an R package for drawing gene clusters, gene arrow maps and transcripts as interactive htmlwidgets. You can use them in the RStudio viewer, R Markdown/Quarto documents and Shiny apps, and export them for publications.
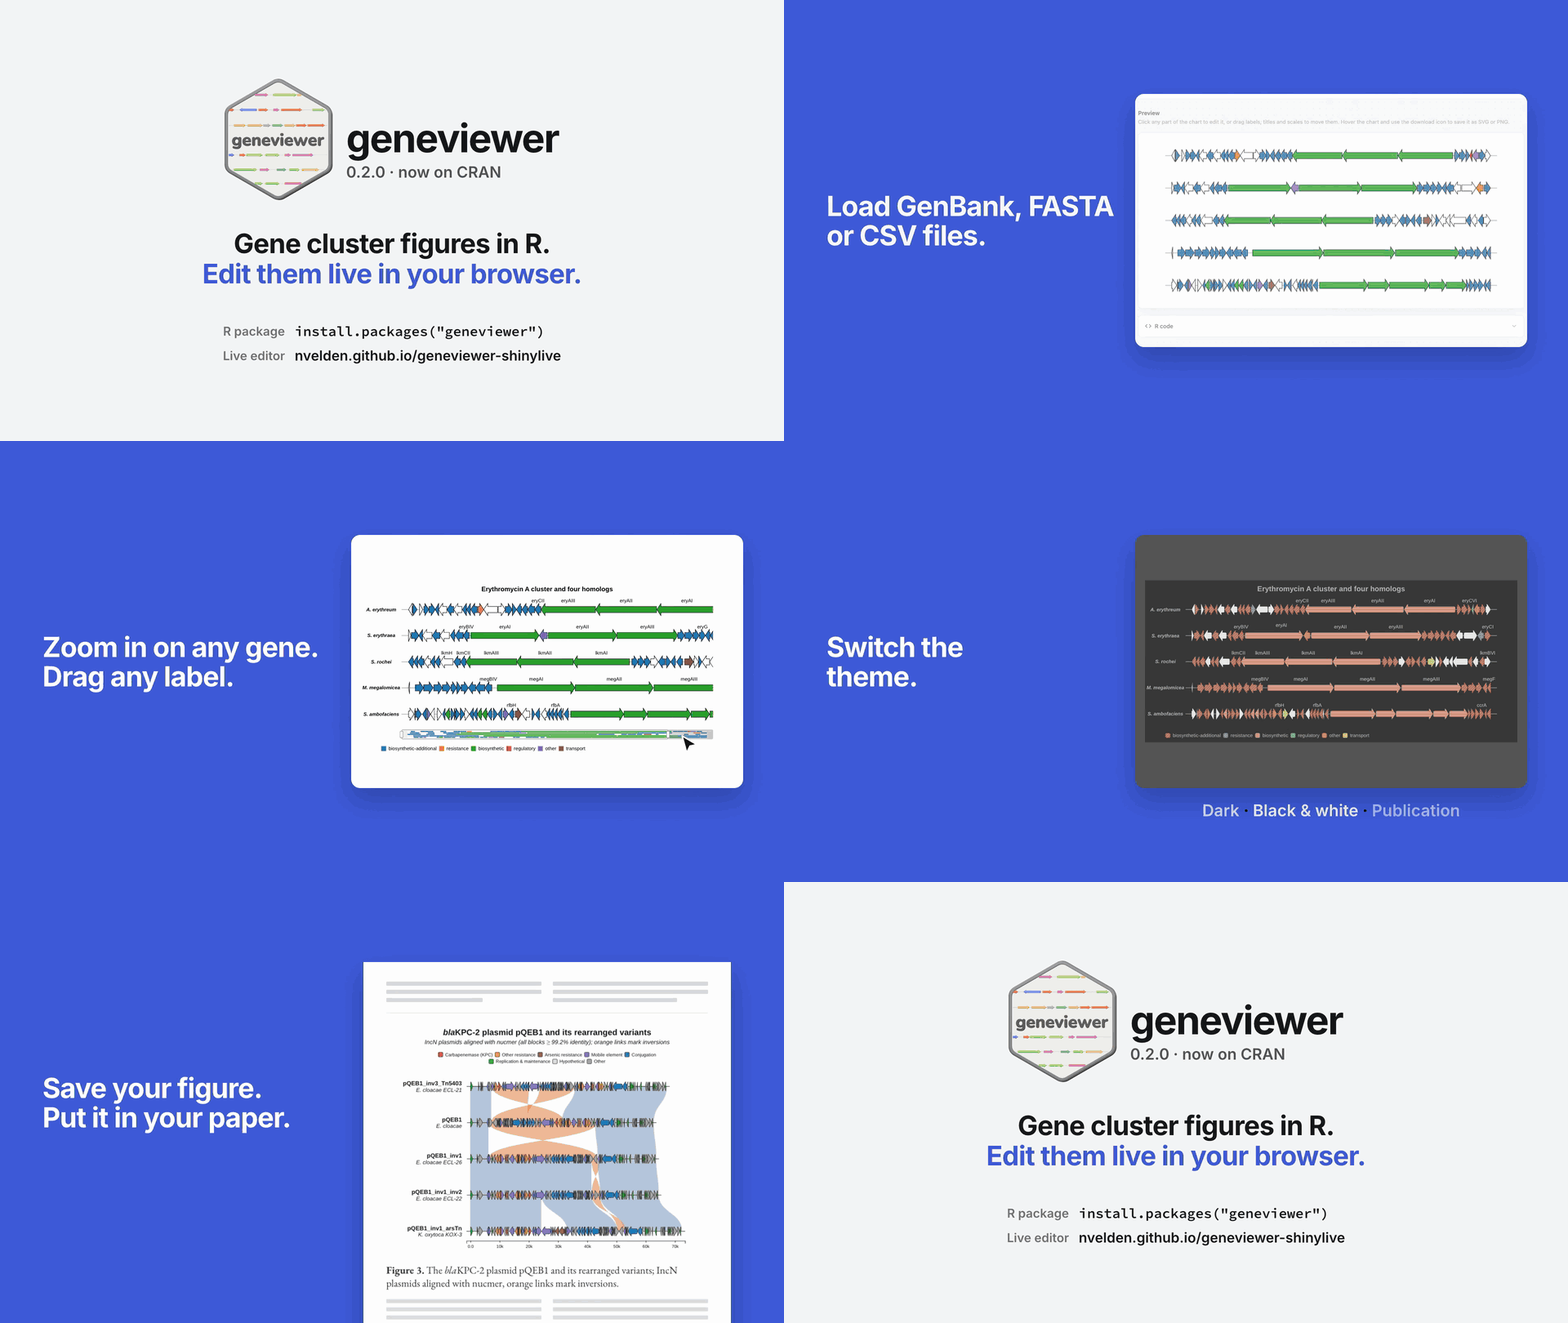
install.packages("geneviewer")
What it does
- Reads GenBank, FASTA, GFF and BED files, or works from a plain data frame
- Compares clusters with protein alignments or MUMmer, and draws the links between them
- Adds titles, labels, legends, scales, annotations and tooltips, all from R
New in 0.2.0
- Themes and patterns:
GC_theme()gives the whole chart a built-in look (including publication and black & white themes), andGC_pattern()fills genes with patterns for greyscale figures - Zooming:
GC_zoom()adds a zoom bar for long clusters and genomes - Editing in the chart: drag labels, titles, scales and legend items, with undo and redo. Selected positions can be saved back to your R code with
GC_element_style() - Save as SVG: the whole chart as one vector file, ready for Illustrator, Inkscape or a journal
- Shiny events:
GC_events()reports clicks, selections and zooms to your app - Faster and smaller: large clusters draw about 10x faster, and
protein_blast()is 3–9x faster
Try it without installing anything: the Gene Cluster Dashboard runs geneviewer in your browser with Shinylive. Load your files, edit the chart by clicking, and copy the R code that recreates it.
Links
- Documentation and examples: Gene Cluster Visualizations • geneviewer
- CRAN: CRAN: Package geneviewer
- GitHub (issues and feedback welcome): GitHub - nvelden/geneviewer: An R package designed for drawing gene arrow maps · GitHub
I'd love to hear what you build with it, and what's missing.