Generating map using shiny and leaflet

I am struggling to create my first shiny app. I am trying to see if I can map data reported by the USDA using their API within shiny environment- using leaflet. I tried to follow an example I found in R Studio Community ~shiny-leaflet-map-filtering-by-years-in-different-columns/1287.

Could you please let me know where the error might have happened? Thanks!

global.r File

## Install and Load Appropriate Packages ##
list.of.packages <- c('tidyr', 'shiny', 'ggplot2', 'RCurl', 'plyr', 'reshape', 'dplyr', 'geojsonio', 'rgdal', "leaflet", "RColorBrewer")
new.packages <- list.of.packages[!(list.of.packages %in% installed.packages()[,"Package"])]

if(length(new.packages)) install.packages(new.packages)

apikey <- "988F7E5A-149B-301F-AF3B-905928EAA13A"
            
library(leaflet)
library(RColorBrewer)            
library(httr)
library(plyr)
library(RCurl)
library(geojsonio)
library(rgdal)
library(shiny)

source("keys.R")

crops <- c("CORN", "WHEAT", "SOYBEANS")
harvest_parameter <- c("CORN, GRAIN - ACRES HARVESTED", "WHEAT - ACRES HARVESTED", "SOYBEANS - ACRES HARVESTED")
fNames <- c("NASS_CORN_DATA", "NASS_WHEAT_DATA", "NASS_SOYBEANS_DATA")
df_request <- data.frame(crops, harvest_parameter, fNames)
dataDir <- "Data"


for (row in 1:nrow(df_request)) {
  crop <- df_request[row, "crops"]
  hp <- df_request[row, "harvest_parameter"]
  eachFile <- df_request[row, "fNames"]
  destFile <- paste0("\\.", crop, "*|csv")
  
  
  # Check if the file exists
  if (!file.exists(paste0(dataDir,"/", eachFile,".csv"))) {
    ## Get data for each crop
    cat(paste0("\n\n\nDownloading Data for :", crop," \n\n"))
    #each_crop <- paste(crop,"api.url4acres")
    cropapi.url4acres <- paste0(
      'http://quickstats.nass.usda.gov/api/api_GET/?key=',
      apikey,
      '&source_desc=SURVEY',
      '&agg_level_desc=STATE',
      '&commodity_desc=',
      crop,
      '&reference_period_desc=YEAR',
      '&year__GE=2000',
      '&short_desc=',
      hp,
      sep = ''
    )
    ### API Get using request parameters
    cropapi.url4acres <- GET(cropapi.url4acres)
    ### Convert from JSON to text
    crop_data <-
      fromJSON(content(cropapi.url4acres, "text"))$data
    ifelse(!dir.exists(file.path("Data")), dir.create(file.path("Data")), FALSE)
    
    write.csv(crop_data, file = paste0("./Data/", paste0(eachFile, ".csv")))
  }
  
  else{
    cat(paste0("\nData already exists for :", crop))
  }
  
}


# Function to convert acres into hectares
in_to_ha <- function(data_in_acres) {
  value_hectare <- data_in_acres * 0.404686
  return(value_hectare)
}

# Read the data

all_crop_production_files <- list.files("Data",
                                        pattern = "*.csv",
                                        full.names = TRUE)


# Reading all the CSV files at onceinstead of a loop, cool beans!

all_crop_production_data <-  do.call(rbind, lapply(all_crop_production_files, read.csv))
keepColumns <- c("state_name", "state_alpha", "Value", "state_ansi","commodity_desc","year")
reducedCropProductionData <- all_crop_production_data[, keepColumns]

# For some reason, the data is stored as factpr, conver it to numeric
reducedCropProductionData[,'Value'] <- as.numeric(reducedCropProductionData[,'Value'])

# Convert the values in hectare
reducedCropProductionData$Value_ha <- sapply(reducedCropProductionData$Value, in_to_ha)


# Write the csv file in output directory
write.csv(reducedCropProductionData, file = paste0(dataDir,"/", "CleanData.txt"))


# Read the json file

# Geo json file obtained from http://eric.clst.org/assets/wiki/uploads/Stuff/gz_2010_us_outline_20m.json 

states <- geojsonio::geojson_read("./Data/gz_2010_us_040_00_20m.json",what = "sp")


# Convert State Name to Proper Case
capFirst <- function(s) {
  paste(toupper(substring(s, 1, 1)), substring(s, 2), sep = "")
}

reducedCropProductionData$state_name <- capFirst(reducedCropProductionData$state_name)

reducedCropProductionDataSp <- merge(states, reducedCropProductionData, by.x = "NAME", by.y = "state_name")
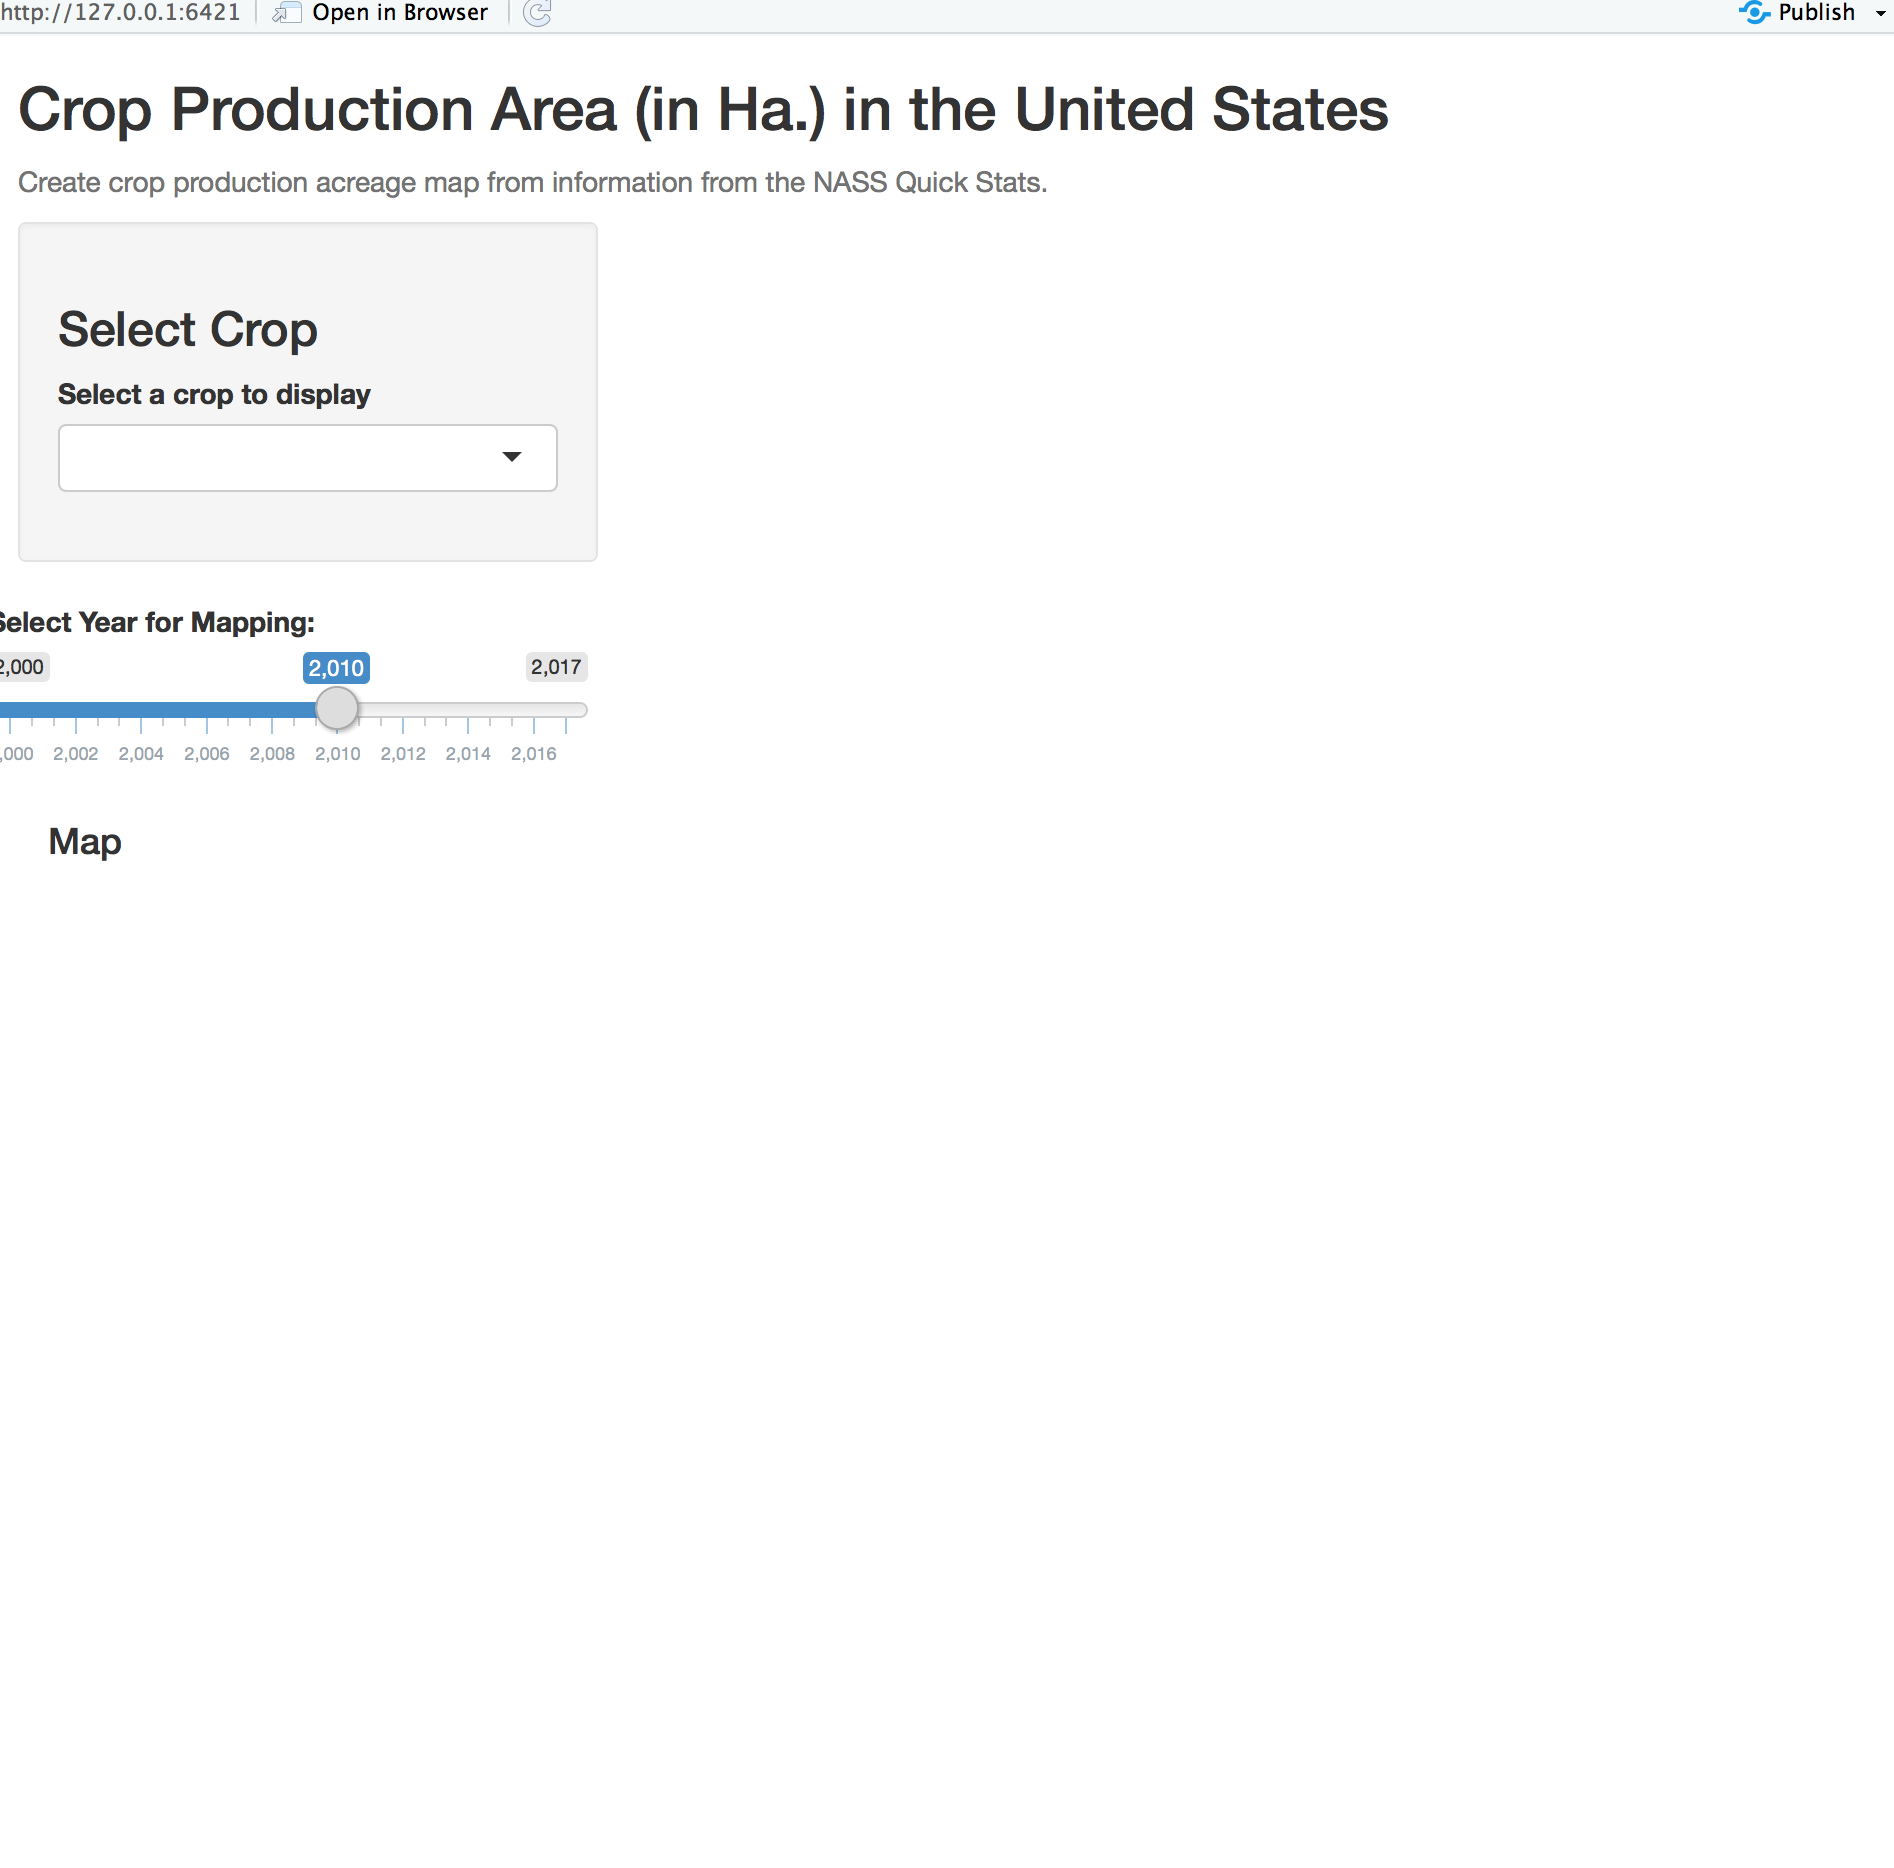
ui.R File:

###### ui.R
# Create User Interface


ui <- fluidPage(
  titlePanel("Crop Production Area (in Ha.) in the United States"),
  helpText(
    "Create crop production acreage map from
    information from the NASS Quick Stats."
  ),
  
  sidebarLayout(
    sidebarPanel(
      h3(" Select Crop"),
      
      selectInput(
        "CropInput",
        label = "Select a crop to display",
        choices = c("Corn", "Soybean", "Wheat"),
        selected = "Corn"
      )
    ),
    
    sliderInput(
      "sliderYear",
      label = "Select Year for Mapping:",
      min = 2000,
      max = 2017,
      value = 2010
    )
  ),
  
  mainPanel(h4(" Map"),
            leafletOutput("myMap",  height = 800))
  )

server.R File:


##### server.R


server <- shinyServer(function(input, output, session) {
  updateSelectizeInput(session,
                       "CropInput",
                       choices = reducedCropProductionDataSp$commodity_desc,
                       server = TRUE)
  # selected crop
  selectedCrop <- reactive({
    reducedCropProductionDataSp[reducedCropProductionDataSp$commodity_desc == input$CropInput,]
  })
  # selected year
  selectedYear <- reactive({
    switch(input$sliderYear,
           reducedCropProductionDataSp$year == input$sliderYear)
  })
  
  pal2 <- colorNumeric(palette = "Greens", domain = NULL)
  
  output$Mymap <- renderLeaflet({
    leaflet(reducedCropProductionDataSp) %>%
      addProviderTiles(providers$Stamen.TonerLite) %>%
      setView(lng = -98.583,
              lat = 39.833,
              zoom = 4) %>%
      addPolygons(
        data = reducedCropProductionDataSp ,
        fillColor = ~ pal2(selectedYear()),
        popup = paste0("<strong>State: </strong>",
                       selectedState()$NAME),
        color = "#BDBDC3",
        fillOpacity = 0.8,
        weight = 1
      )
    
  })
  
})


Run the shiny app


runApp()

In your ui.R file, you're closing the parenthesis on the Leaflet object too early:

mainPanel(
      h4(" Map"),
      leafletOutput("myMap"),  height = 800)
  )

Perhaps you meant:

mainPanel(
      h4(" Map"),
      leafletOutput("myMap",  height = 800)
  )

Try that first :smiley:

Edit: You're also referring to it wrong in the server.R file, it should be output$myMap not output$mymap

Thanks for finding those errors, still it is not rendering anything.

Is there any output from the RStudio console?

You've got quite a lot going on for your first Shiny app. I'd recommend stripping it down to the bare bones and building it up. Don't put anything on your Leaflet map till you can at least get it displayed.

Could you try making a reprex ?

https://forum.posit.co/t/faq-whats-a-reproducible-example-reprex-and-how-do-i-do-one/5219

Try the steps on this page https://rstudio.github.io/leaflet/ to get the basics nailed :smiley:

1 Like

I cannot get past the last line in global.R file. my states object doesnt have "NAME" column therefore merge f() is returning error. Can you provide the head output of your states@data?

head(states@data)
TYPE R_STATEFP L_STATEFP
0 MEXICAN 48
1 MEXICAN 35
2 COASTAL 55
3 COASTAL 55
4 COASTAL 55
5 COASTAL 55

Edit: As per @MLavoie21's suggestions, I have fixed some typos and adjusted the year formatting for slider input, now the year slider does not have commas.

I agree with @ciaranevans suggestions and decided to keep just the bare-bones. Instead of leaflet, I chose to map with googleVis.

Here is the ui.R file:

library(shiny)


# Define UI for application that draws a histogram
ui <- fluidPage(
  
  # Application title
  titlePanel("Cropped Acreage"),
  
  # Sidebar with a slider input  and select input 
  sidebarLayout(
    sidebarPanel(
      
      selectizeInput("CropInput",
                  label = "Select a crop to display",
                  choices = c("CORN", "SOYBEANS", "WHEAT"),
                  selected = "CORN"
                  ),


      sliderInput("SliderYear",
                  "Select Year:",
                  min = 2011,
                  max = 2017,
                  value = 2014,
                  sep = ""
)
    ),
    
    # Show a plot of the generated distribution
    mainPanel(
      htmlOutput("plot1")
    )
  )
)

And the server.R file

library(shiny)
library(dplyr)
#> 
#> Attaching package: 'dplyr'
#> The following objects are masked from 'package:stats':
#> 
#>     filter, lag
#> The following objects are masked from 'package:base':
#> 
#>     intersect, setdiff, setequal, union
library(stringr)
library(googleVis)
#> Creating a generic function for 'toJSON' from package 'jsonlite' in package 'googleVis'
#> 
#> Welcome to googleVis version 0.6.2
#> 
#> Please read Google's Terms of Use
#> before you start using the package:
#> https://developers.google.com/terms/
#> 
#> Note, the plot method of googleVis will by default use
#> the standard browser to display its output.
#> 
#> See the googleVis package vignettes for more details,
#> or visit http://github.com/mages/googleVis.
#> 
#> To suppress this message use:
#> suppressPackageStartupMessages(library(googleVis))

nass_df <- read.csv('https://pastebin.com/raw/ndRBUsKK')
nass_df$state_name <- str_to_title(nass_df$state_name)
nass_df <- subset(nass_df, state_name != "Other States" & year > 2011)


server = function(input, output) {
  datasetInput = reactive({
    datasetInputFilter <- nass_df %>% 
      filter(commodity_desc == input$CropInput & year == input$SliderYear)
  })
  
  output$plot1 = renderGvis({
    gvisGeoChart(datasetInput()[complete.cases(datasetInput()), ] ,
                 "state_name",
                 "Value_ha",
                 options = list(
                   region = "US",
                   displayMode = "regions",
                   resolution = "provinces",
                   width = 800,
                   height = 600
                 )
   
    )
   
  })
  }

Created on 2018-04-15 by the reprex package (v0.2.0).

The issue is still the same, only side panel renders not the map!

Thank you for your suggestion.

No problem.

Do you know about developer tools in Chrome? I can see in the console you're getting:

Uncaught Error: Row given with size different than 3 (the number of columns in the table).
    at gvjs_R.gvjs_.g2 (format+en,default+en,ui+en,geochart+en.I.js:280)
    at gvjs_R.gvjs_.nu (format+en,default+en,ui+en,geochart+en.I.js:281)
    at gvisDataGeoChartID67b117ac3d0 (eval at <anonymous> (jquery.min.js:2), <anonymous>:16:6)
    at drawChartGeoChartID67b117ac3d0 (eval at <anonymous> (jquery.min.js:2), <anonymous>:23:12)
    at callback (eval at <anonymous> (jquery.min.js:2), <anonymous>:75:18)

Every time the plot tries to render. Any reason why you switched to googleVis?

I'd still say this needs to be even more lightweight. Try to just get the map on screen, don't worry about data.

The reason I switched to googleVis is that there was no need to import external spatial files (JSON, or shapefile). I plotted a year of data for a crop and I got the output without any errors.

Great to hear you got it working!

Would you mind posting what fixed it?

It will help anyone else with the same issue, marking this as solved will also help! :smiley:

Maybe you misunderstood me, I generated map only for a year. The shiny app, however, is still not working.

I can make you map works. You must fix a couple of typos in your code.

First, in choices = c("Corn", "Soybeans", "Wheat"), you should capitalize CORN, SOYBEANS, and WHEAT as in nass_df.

Second, in region = "U.S.", it should be region = "US",.

hope it helps
Martin

1 Like

Appreciate your help @MLavoie21. Case sensitivity matters, a valuable lesson!