Generate table only when updating numericInput in a shiny app

Can you help me with the following problem: I made an app that uses Weighted Sum Method (WSM) method in a given database. I can generate the final dataset normally, which is the scaled variable. Now I'm using this code together with Shiny, but notice that the weights of the two criteria I did manually (I considered 0.5 for both), however, I would like the code to recognize the values I insert in the two numericInput, instead of this way: weights <- c(0.5,0.5).

Executable code below:

library(shiny)
library(shinythemes)
library(dplyr)

df1<-structure(list(nclusters = c(2, 3, 4, 5, 6, 7, 8, 9, 10, 11, 
12, 13, 14, 15, 16, 17, 18, 19, 20, 21, 22, 23, 24, 25, 26, 27, 
28, 29, 30, 31, 32, 33, 34, 35), Coverage = c(0.0363201192049018, 
0.0315198954715543, 0.112661460735583, 0.112661460735583, 0.112661460735583, 
0.0813721071219816, 0.0862146652218061, 0.0697995564757394, 0.0599194966471805, 
0.0507632014547115, 0.052076958349629, 0.052076958349629, 0.052076958349629, 
0.052076958349629, 0.052076958349629, 0.052076958349629, 0.0410332568832433, 
0.0389940601722214, 0.0441742111970355, 0.0441742111970355, 0.0441742111970355, 
0.0438099091238968, 0.0409906284310306, 0.0409906284310306, 0.035480410134286, 
0.035480410134286, 0.035480410134286, 0.035480410134286, 0.035480410134286, 
0.035480410134286, 0.035480410134286, 0.0345381204372174, 0.0287729883480053, 
0.0287729883480053), Production = c(1635156.04305, 474707.64025, 
170773.40775, 64708.312, 64708.312, 64708.312, 949.72635, 949.72635, 
949.72635, 949.72635, 949.72635, 949.72635, 949.72635, 949.72635, 
949.72635, 949.72635, 949.72635, 949.72635, 949.72635, 949.72635, 
949.72635, 949.72635, 949.72635, 949.72635, 949.72635, 949.72635, 
949.72635, 949.72635, 949.72635, 949.72635, 949.72635, 949.72635, 
949.72635, 949.72635)), class = "data.frame", row.names = c(NA,-34L))

weights <- c(0.5,0.5) 

scaled <- df1 |>
  mutate(Coverage = min(Coverage) / Coverage,
         Production = Production / max(Production))

scaled <- scaled |>
  rowwise() |>
  mutate(`Performance Score` = weighted.mean(c(Coverage, Production), w = weights))

scaled$Rank <- (nrow(scaled) + 1) - rank(scaled$`Performance Score`)

ui <- fluidPage(

    column(4,
         wellPanel(
           
  numericInput("weight1", label = h4("Weight 1"),
               min = 0, max = 1, value = ""),
  
  numericInput("weight2", label = h4("Weight 2"),
               min = 0, max = 1, value = ""),
  
  helpText("The sum of weights should be equal to 1"))),
  
  hr(),
  
  column(8,
         tabsetPanel(
           tabPanel("table", dataTableOutput('table'))))

)

server <- function(input, output,session) {
  
  observeEvent(input$weight1, {
    updateNumericInput(session, 'weight2',
                       value = 1 - input$weight1)
  })

  output$table <- renderDataTable({
  datatable (scaled,options = list(columnDefs = list(list(className = 'dt-center', targets = "_all")),
                                            paging =TRUE,searching = FALSE, pageLength =  10,dom = 'tip',scrollX=TRUE),
               rownames = FALSE) 
  
    })
}

shinyApp(ui = ui, server = server)
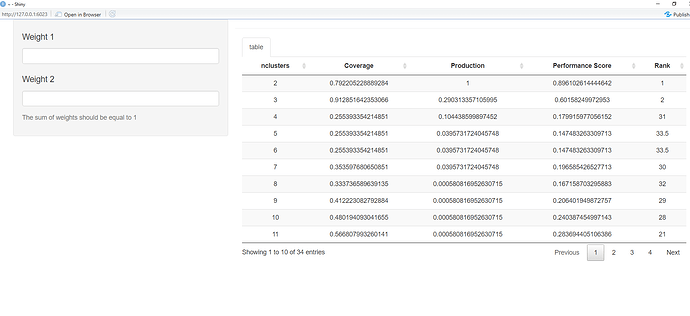
make scaled a reactive expression calculated within the server code, that takes dependencies on your two weight inputs.
To learn about reactive expressions you can read here
Chapter 15 Reactive building blocks | Mastering Shiny (mastering-shiny.org)

1 Like

@nirgrahamuk , thanks for reply. I managed to solve it as suggested, as you can see in the resolution below.

library(shiny)
library(DT)
library(dplyr)
library(shinyjs)

df1 <- structure(list(nclusters = c(2, 3, 4, 5, 6, 7, 8, 9, 10, 11, 12, 13, 14,
15, 16, 17, 18, 19, 20, 21, 22, 23, 24, 25, 26, 27, 28, 29, 30, 31, 32, 33,
34, 35), Coverage = c(0.0363201192049018, 0.0315198954715543,
0.112661460735583, 0.112661460735583, 0.112661460735583, 0.0813721071219816,
0.0862146652218061, 0.0697995564757394, 0.0599194966471805,
0.0507632014547115, 0.052076958349629, 0.052076958349629, 0.052076958349629,
0.052076958349629, 0.052076958349629, 0.052076958349629, 0.0410332568832433,
0.0389940601722214, 0.0441742111970355, 0.0441742111970355,
0.0441742111970355, 0.0438099091238968, 0.0409906284310306,
0.0409906284310306, 0.035480410134286, 0.035480410134286, 0.035480410134286,
0.035480410134286, 0.035480410134286, 0.035480410134286, 0.035480410134286,
0.0345381204372174, 0.0287729883480053, 0.0287729883480053), Production =
c(1635156.04305, 474707.64025, 170773.40775, 64708.312, 64708.312, 64708.312,
949.72635, 949.72635, 949.72635, 949.72635, 949.72635, 949.72635, 949.72635,
949.72635, 949.72635, 949.72635, 949.72635, 949.72635, 949.72635, 949.72635,
949.72635, 949.72635, 949.72635, 949.72635, 949.72635, 949.72635, 949.72635,
949.72635, 949.72635, 949.72635, 949.72635, 949.72635, 949.72635, 949.72635)),
class = "data.frame", row.names = c(NA,-34L))

ui <- fluidPage(
  useShinyjs(),
  column(4,
         wellPanel(
           numericInput(
             "weight1",
             label = h4("Weight 1"),
             min = 0,
             max = 1,
             value = NA,
             step = 0.1
           ),
           disabled(numericInput(
             "weight2",
             label = h4("Weight 2"),
             min = 0,
             max = 1,
             value = NA,
             step = 0.1
           )),
           helpText("The sum of weights should be equal to 1")
         )),
  hr(),
  column(8,
         tabsetPanel(tabPanel(
           "table", DTOutput('table')
         ))))

server <- function(input, output, session) {
  
  scaled <- reactive({
    weights <- c(req(input$weight1), req(input$weight2))
    
    scaled <- df1 |>
      mutate(Coverage = min(Coverage) / Coverage,
             Production = Production / max(Production))
    
    scaled <- scaled |>
      rowwise() |>
      mutate(`Performance Score` = weighted.mean(c(Coverage, Production), w = weights))
    
    scaled$Rank <- (nrow(scaled) + 1) - rank(scaled```
Performance Score`)
    
    scaled
  })
  
  observeEvent(input$weight1, {
    freezeReactiveValue(input, "weight2")
    updateNumericInput(session, 'weight2', value = 1 - input$weight1)
  })
  
  output$table <- renderDT({
    req(scaled())
    datatable(
      scaled(),
      options = list(
        columnDefs = list(list(
          className = 'dt-center', targets = "_all"
        )),
        paging = TRUE,
        searching = FALSE,
        pageLength =  10,
        dom = 'tip',
        scrollX = TRUE
      ),
      rownames = FALSE
    )
  })
}

shinyApp(ui = ui, server = server)

However, I would like to see the possibility of not stripping the code referring to the WSM calculation on server. In this case, this part of code:

weights <- c(0.5,0.5) 

scaled <- df1 |>
  mutate(Coverage = min(Coverage) / Coverage,
         Production = Production / max(Production))

scaled <- scaled |>
  rowwise() |>
  mutate(`Performance Score` = weighted.mean(c(Coverage, Production), w = weights))

scaled$Rank <- (nrow(scaled) + 1) - rank(scaled$`Performance Score`)

Therefore, is there any other solution approach?

Sorry , I don't understand your question. Can you ask it a different way ?

@nirgrahamuk I didn't want to put the WSM calculation on the server so I thought of some differrent resolution different approach to this issue. So I did like this:

library(shiny)
library(shinythemes)
library(dplyr)

df1<-structure(list(nclusters = c(2, 3, 4, 5, 6, 7, 8, 9, 10, 11, 
                                  12, 13, 14, 15, 16, 17, 18, 19, 20, 21, 22, 23, 24, 25, 26, 27, 
                                  28, 29, 30, 31, 32, 33, 34, 35), Coverage = c(0.0363201192049018, 
                                                                                0.0315198954715543, 0.112661460735583, 0.112661460735583, 0.112661460735583, 
                                                                                0.0813721071219816, 0.0862146652218061, 0.0697995564757394, 0.0599194966471805, 
                                                                                0.0507632014547115, 0.052076958349629, 0.052076958349629, 0.052076958349629, 
                                                                                0.052076958349629, 0.052076958349629, 0.052076958349629, 0.0410332568832433, 
                                                                                0.0389940601722214, 0.0441742111970355, 0.0441742111970355, 0.0441742111970355, 
                                                                                0.0438099091238968, 0.0409906284310306, 0.0409906284310306, 0.035480410134286, 
                                                                                0.035480410134286, 0.035480410134286, 0.035480410134286, 0.035480410134286, 
                                                                                0.035480410134286, 0.035480410134286, 0.0345381204372174, 0.0287729883480053, 
                                                                                0.0287729883480053), Production = c(1635156.04305, 474707.64025, 
                                                                                                                    170773.40775, 64708.312, 64708.312, 64708.312, 949.72635, 949.72635, 
                                                                                                                    949.72635, 949.72635, 949.72635, 949.72635, 949.72635, 949.72635, 
                                                                                                                    949.72635, 949.72635, 949.72635, 949.72635, 949.72635, 949.72635, 
                                                                                                                    949.72635, 949.72635, 949.72635, 949.72635, 949.72635, 949.72635, 
                                                                                                                    949.72635, 949.72635, 949.72635, 949.72635, 949.72635, 949.72635, 
                                                                                                                    949.72635, 949.72635)), class = "data.frame", row.names = c(NA,-34L))
get_scaled <- function(w1,w2,m1,m2) {
  
  weights = c(w1,w2)
  
  method = list("-" = min,"+"=max)
  
  m1 = method[[m1]]
  
  m2 = method[[m2]]
  
  scaled <- df1 |>
    mutate(Coverage = m1(Coverage) / Coverage,
           Production = Production / m2(Production))
  
  scaled <- scaled |>
    rowwise() |>
    mutate(`Performance Score` = weighted.mean(c(Coverage, Production), w = weights))
  
  scaled$Rank <- (nrow(scaled) + 1) - rank(scaled$`Performance Score`)
  
  return(scaled)
}


ui <- fluidPage(
  
  column(4,
         wellPanel(
           
           numericInput("weight1", label = h4("Weight 1"),
                        min = 0, max = 1, value = ""),
           
           selectInput("maxmin1", label = h5("Maximize or Minimize?"),
                       choices = list("","Maximize " = "+", "Minimize" = "-"), selected = NULL),
           
           numericInput("weight2", label = h4("Weight 2"),
                        min = 0, max = 1, value = ""),
           
           selectInput("maxmin2", label = h5("Maximize or Minimize?"),
                       choices = list("","Maximize " = "+", "Minimize" = "-"), selected = NULL),
           helpText("The sum of weights should be equal to 1"))),  
  hr(),
  
  column(8,
         tabsetPanel(
           tabPanel("table", dataTableOutput('table'))))
  
)

server <- function(input, output,session) {
  
  v <- reactiveValues(df = NULL)
  
  observeEvent(input$weight1, {
    updateNumericInput(session, 'weight2',
                       value = 1 - input$weight1)
  })
  
  scaled <- reactive({
    get_scaled(input$weight1, input$weight2, input$maxmin1,input$maxmin2)
  })
  
  
  output$table <- renderDataTable({
    datatable (scaled(),options = list(columnDefs = list(list(className = 'dt-center', targets = "_all")),
                                       paging =TRUE,searching = FALSE, pageLength =  10,dom = 'tip',scrollX=TRUE),
               rownames = FALSE) 
    
  })
}

shinyApp(ui = ui, server = server)

It worked. If you make changes to selecInput and numericInput, you will be able to generate the values ​​correctly. The only strange thing is that an error message appears when I run the APP, do you know what it could be?

This topic was automatically closed 54 days after the last reply. New replies are no longer allowed.

If you have a query related to it or one of the replies, start a new topic and refer back with a link.