Gantt Plot x-axis

Hello, I was creating a gantt plot for some made up data and I was noticing that the x-axis for my data not going off of 0, 0.5, 1, 1.5, 2, 2.5. Intead, the x-axis was going off of the discrete values that I provided. Is there any way to fix my data so that the lines for each patient is placed on a x-axis from 0->2.5 by 0.5 breaks? Thank you so much!

This is the code I am working with:

Gantt_Plot_Data_1<-tibble::tribble(
                     ~Item, ~Patient, ~Drug.dose, ~'Start/End', ~Month,
                         1,       1,         4,      "Start",   0.13,
                         2,       1,         4,        "End",   0.55,
                         3,       1,         2,      "Start",   0.65,
                         4,       1,         2,        "End",   0.77,
                         5,       2,        10,      "Start",    0.1,
                         6,       2,        10,        "End",   0.17,
                         7,       2,         8,      "Start",    0.2,
                         8,       2,         8,        "End",   0.23,
                         9,       2,         2,      "Start",    0.4,
                        10,       2,         2,        "End",   0.67
                     )
head(Gantt_Plot_Data_1)
#> # A tibble: 6 x 5
#>    Item Patient Drug.dose `Start/End` Month
#>   <dbl>   <dbl>     <dbl> <chr>       <dbl>
#> 1     1       1         4 Start        0.13
#> 2     2       1         4 End          0.55
#> 3     3       1         2 Start        0.65
#> 4     4       1         2 End          0.77
#> 5     5       2        10 Start        0.1 
#> 6     6       2        10 End          0.17

library(ggplot2)
library(tidyverse)
Gantt_Plot_Data_1$Item<- as.integer(Gantt_Plot_Data_1$Item)
Gantt_Plot_Data_1$Patient<- as.factor(Gantt_Plot_Data_1$Patient)
Gantt_Plot_Data_1$Drug.dose<-as.factor(Gantt_Plot_Data_1$Drug.dose)
Gantt_Plot_Data_1$Month<-as.character(Gantt_Plot_Data_1$Month)
#Start/End is a character
ggplot(Gantt_Plot_Data_1, aes(Month, Patient, color=Drug.dose, group=Patient))+geom_line(size=10)+labs(x="Month from Surgery", y= "Patient", title = "Drug Dose")+ scale_x_discrete(breaks= seq(0,2.5, by=0.5),labels=c(0,0.5,1,1.5,2,2.5))
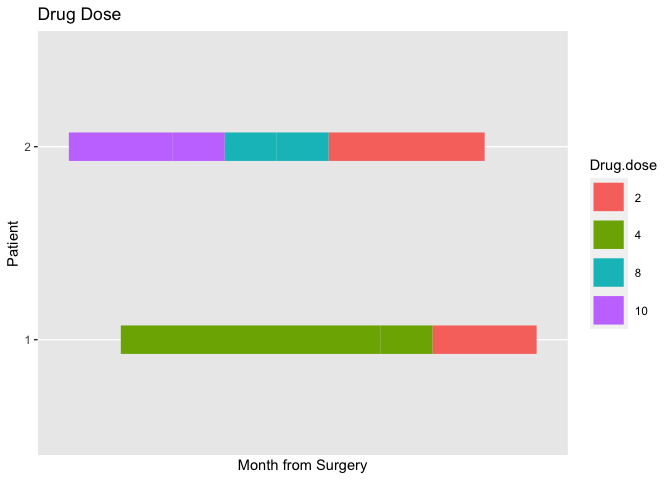
image

I'm not sure I understand. aes(x = Month... implies you want the month data to drive the x position, and you have just previously changed the Month decimal numbers c(0.13, 0.55 etc.) into character values c("0.13", "0.55", etc.) It looks like 10 distinct numbers-as-characters there, so how should that map to 0->2.5 by 0.5 breaks (6 steps)?

I'm guessing you really want to keep Month as a continuous variable, and that you want each line to go from start to end, in which case you can use:

library(tidyverse)
Gantt_Plot_Data_1$Patient = as.factor(Gantt_Plot_Data_1$Patient)
Gantt_Plot_Data_1$Drug.dose<-as.factor(Gantt_Plot_Data_1$Drug.dose)
Gantt_Plot_Data_1 %>%
  select(-Item) %>%
  pivot_wider(names_from = `Start/End`, values_from = Month) %>%
  ggplot(aes(y = Patient, color=Drug.dose, group=Patient)) +
  geom_segment(aes(x = Start, xend = End, yend = Patient), size = 10) +
  scale_x_continuous(breaks = seq(0, 2.5, by = 0.5)) +
  coord_cartesian(xlim = c(0, 2.5)) +
  labs(x="Month from Surgery", y= "Patient", 
       title = "Drug Dose")

1 Like

Hello @jonspring,
Thank you so much!
That is exactly what I needed! This will help me out tremendously and I really appreciate your quick response.
Thank you again for your help, and I hope you have a great day!

Hello @jonspring,
Thank you so much for helping me with this smaller data set! While I learned that this data set worked well for the smaller data set that I provided you, it seemed to give an error when I tried to use a similar code for a much larger data set. To you happen to know why this error may pop up?
Thank you so much in advance!

Error code:

Error in is.finite(x) : default method not implemented for type 'list'In addition: Warning message:Values are not uniquely identified; output will contain list-cols.

  • Use values_fn = list to suppress this warning.
  • Use values_fn = length to identify where the duplicates arise
  • Use values_fn = {summary_fun} to summarise duplicates

This it also the code that I tried to run.

Gantt_Plot_Data_2<-tibble::tribble(
                     ~Item, ~Patient, ~Drug.dose, ~`Start/End`, ~Month,
                         1,       1,         4,      "Start",   0.13,
                         2,       1,         4,        "End",   0.55,
                         3,       1,         2,      "Start",   0.65,
                         4,       1,         2,        "End",   0.77,
                         5,       2,        10,      "Start",    0.1,
                         6,       2,        10,        "End",   0.17,
                         7,       2,         8,      "Start",    0.2,
                         8,       2,         8,        "End",   0.23,
                         9,       2,         2,      "Start",    0.4,
                        10,       2,         2,        "End",   0.67,
                        11,       3,        10,      "Start",   0.13,
                        12,       3,        10,        "End",   0.17,
                        13,       3,         5,      "Start",   0.23,
                        14,       3,         5,        "End",   0.27,
                        15,       3,         4,      "Start",   0.29,
                        16,       3,         4,        "End",   0.32,
                        17,       3,         2,      "Start",   0.39,
                        18,       3,         2,        "End",   0.45,
                        19,       3,         2,      "Start",   0.52,
                        20,       3,         2,        "End",   0.55,
                        21,       3,         6,      "Start",   1.03,
                        22,       3,         6,        "End",   1.06,
                        23,       3,         5,      "Start",   1.13,
                        24,       3,         5,        "End",   1.45,
                        25,       3,         3,      "Start",   1.48,
                        26,       3,         3,        "End",   1.68,
                        27,       4,        10,      "Start",   0.06,
                        28,       4,        10,        "End",    0.1,
                        29,       4,         8,      "Start",   0.13,
                        30,       4,         8,        "End",   0.19,
                        31,       4,         6,      "Start",   0.23,
                        32,       4,         6,        "End",   0.26,
                        33,       4,         6,      "Start",   0.32,
                        34,       4,         6,        "End",   0.35,
                        35,       4,         4,      "Start",   0.35,
                        36,       4,         4,        "End",   0.39,
                        37,       4,         2,      "Start",   0.45,
                        38,       4,         2,        "End",   0.48,
                        39,       4,         4,      "Start",   0.65,
                        40,       4,         2,        "End",   0.87,
                        41,       4,         2,      "Start",   0.97,
                        42,       4,         2,        "End",   1.06,
                        43,       5,        10,      "Start",      0,
                        44,       5,        10,        "End",   0.03,
                        45,       5,        10,      "Start",   0.06,
                        46,       5,        10,        "End",    0.1,
                        47,       5,        10,      "Start",   0.13,
                        48,       5,        10,        "End",   0.26,
                        49,       5,         8,      "Start",   0.29,
                        50,       5,         8,        "End",   0.32,
                        51,       5,         6,      "Start",   0.35,
                        52,       5,         6,        "End",   0.39,
                        53,       5,         4,      "Start",   0.42,
                        54,       5,         4,        "End",   0.45,
                        55,       5,         2,      "Start",   0.48,
                        56,       5,         2,        "End",   0.52,
                        57,       6,        10,      "Start",      0,
                        58,       6,        10,        "End",   0.03,
                        59,       6,        10,      "Start",   0.07,
                        60,       6,        10,        "End",    0.1,
                        61,       6,        10,      "Start",   0.13,
                        62,       6,        10,        "End",    0.2,
                        63,       6,        10,      "Start",   0.23,
                        64,       6,        10,        "End",   0.33,
                        65,       6,        10,      "Start",   0.37,
                        66,       6,        10,        "End",   0.43,
                        67,       6,        10,      "Start",   0.48,
                        68,       6,        10,        "End",   0.52,
                        69,       6,        10,      "Start",   0.55,
                        70,       6,        10,        "End",   0.61,
                        71,       6,         8,      "Start",   0.65,
                        72,       6,         8,        "End",   0.71,
                        73,       7,         6,      "Start",    0.1,
                        74,       7,         6,        "End",   0.23,
                        75,       7,        10,      "Start",   0.27,
                        76,       7,        10,        "End",    0.3,
                        77,       7,         8,      "Start",   0.33,
                        78,       7,         8,        "End",   0.37,
                        79,       7,         6,      "Start",    0.4,
                        80,       7,         6,        "End",   0.43,
                        81,       7,         4,      "Start",   0.47,
                        82,       7,         4,        "End",    0.5,
                        83,       7,         2,      "Start",   0.53,
                        84,       7,         2,        "End",   0.57,
                        85,       7,         2,      "Start",    0.6,
                        86,       7,         2,        "End",   0.63,
                        87,       7,         2,      "Start",   0.67,
                        88,       7,         2,        "End",    0.7,
                        89,       8,         6,      "Start",   0.06,
                        90,       8,         6,        "End",   0.16,
                        91,       8,         8,      "Start",   0.23,
                        92,       8,         8,        "End",   0.29,
                        93,       8,        10,      "Start",   0.39,
                        94,       8,        10,        "End",   0.42,
                        95,       8,         6,      "Start",   0.77,
                        96,       8,         6,        "End",      1,
                        97,       8,         4,      "Start",   1.03,
                        98,       8,         4,        "End",   1.71
                     )
head(Gantt_Plot_Data_2)
#> # A tibble: 6 x 5
#>    Item Patient Drug.dose `Start/End` Month
#>   <dbl>   <dbl>     <dbl> <chr>       <dbl>
#> 1     1       1         4 Start        0.13
#> 2     2       1         4 End          0.55
#> 3     3       1         2 Start        0.65
#> 4     4       1         2 End          0.77
#> 5     5       2        10 Start        0.1 
#> 6     6       2        10 End          0.17
                      

library(tidyverse)
Gantt_Plot_Data_2$Patient = as.factor(Gantt_Plot_Data_2$Patient)
Gantt_Plot_Data_2$Drug.dose<-as.factor(Gantt_Plot_Data_2$Drug.dose)
Gantt_Plot_Data_2$Month<- as.numeric(Gantt_Plot_Data_2$Month)
Gantt_Plot_Data_2 %>%
  select(-Item) %>%
  pivot_wider(names_from = 'Start/End', values_from = Month) %>%
  ggplot(aes(y = Patient, color=Drug.dose, group=Patient)) +
  geom_segment(aes(x = Start, xend = End, yend = Patient), size = 10) +
  scale_x_continuous(breaks = seq(0, 2.5, by = 0.5)) +
  coord_cartesian(xlim = c(0, 2.5)) +
  labs(x="Month from Surgery", y= "Patient", 
       title = "Drug Dose")
#> Warning: Values are not uniquely identified; output will contain list-cols.
#> * Use `values_fn = list` to suppress this warning.
#> * Use `values_fn = length` to identify where the duplicates arise
#> * Use `values_fn = {summary_fun}` to summarise duplicates
#> Error in is.finite(x): default method not implemented for type 'list'

This topic was automatically closed 7 days after the last reply. New replies are no longer allowed.

If you have a query related to it or one of the replies, start a new topic and refer back with a link.