Hi!
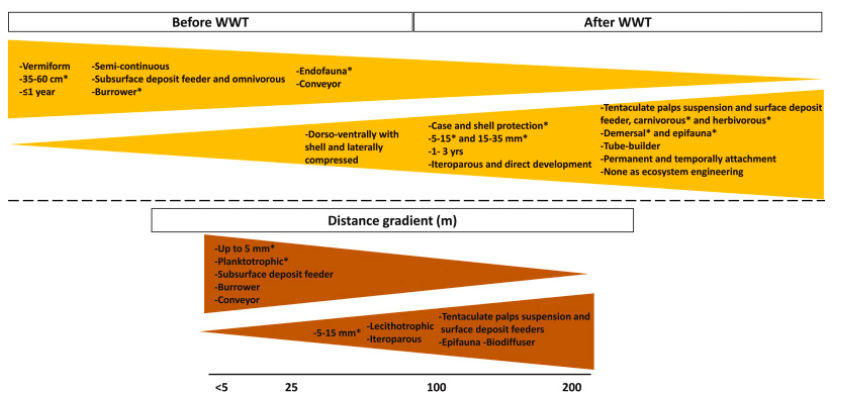
Does anyone know how to make this type of graph (attached) in Rstudio? I would like to do this with my dataset, of which I give an example below.:
Etapa = c("Antes", "Antes", "Antes", "Antes", "Antes", "Antes", "Despues", "Despues", "Despues", "Despues"),
  Distancia = c("costera", "costera", "zona.difusores", "zona.difusores", "sitio.referencia", "sitio.referencia",
                "costera", "costera", "zona.difusores", "zona.difusores"),
  Lado = c("Norte", "Sur", "Norte", "Sur", "Norte", "Sur", "Norte", "Sur", "Norte", "Sur"),
  pequeño = c(2740, 4100, 18380, 3880, 7300, 520, 3160, 1980, 1130, 522),
  mediano = c(2240, 3240, 2700, 11680, 1760, 3700, 15590, 1070, 2850, 4523),
  grande = c(1080, 980, 8380, 6580, 2080, 1822, 3320, 1120, 14900, 2531),
  ali.deposito = c(1580, 1740, 17160, 10220, 4400, 4922, 17400, 2700, 16230, 3471),
  predaror = c(2180, 3440, 4680, 4920, 1840, 940, 980, 990, 1950, 442),
  filtrador.sus = c(1400, 1780, 17040, 5180, 6180, 4320, 18860, 2670, 2850, 4660),
  herbiboro = c(520, 20, 6420, 3640, 3880, 460, 2230, 80, 630, 32),
  baja = c(3360, 4460, 19920, 13220, 7660, 4760, 19310, 1920, 16120, 4893),
  media = c(980, 800, 5280, 2600, 2980, 1820, 1680, 1860, 1870, 712),
  alta = c(160, 100, 6880, 460, 1840, 222, 430, 30, 880, 20),
If it is not possible to make this kind of graphs, I would like some ideas on how to represent my data in the best way.