Hi , I am trying to create a function to create a summary for values in two columns.
sample data
df <- data.frame("Tier1 City"=c(NA,"","Ottawa","","buenes aries","New York","washington DC"),
                    "Tier2 City"= c(NA,"","Ottawa","","buenes aries","","washington DC"))


i have tried with tabyl(janitor), table function but not working as i want
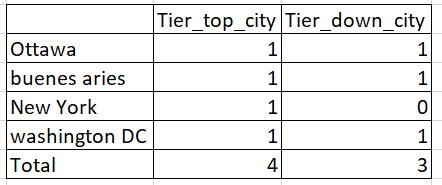
i am looking for a function where i can give input parameters as data,variable list , and name of variable i want in summary output.
the output should be look like.
Hi,
Here is an example:
library(dplyr)
library(tidyr)

df <- data.frame("Tier1City"=c(NA,"","Ottawa","","buenes aries","New York","washington DC"),
                 "Tier2City"= c(NA,"","Ottawa","","buenes aries","","washington DC"))

myFunction = function(dataframe){
  df = df %>% pivot_longer(everything()) %>%
    group_by(value, name) %>% summarise(n = n(), .groups = "drop") %>%
    pivot_wider(value, names_from = name, values_from = n, values_fill = 0) %>%
    filter(value != "")

  df[nrow(df) + 1,1] = "TOTAL"
  df[nrow(df),-1] = as.list(colSums(df[,-1], na.rm = T))

  df
}

myFunction(df)
#> # A tibble: 5 x 3
#>   value         Tier1City Tier2City
#>   <chr>             <int>     <int>
#> 1 buenes aries          1         1
#> 2 New York              1         0
#> 3 Ottawa                1         1
#> 4 washington DC         1         1
#> 5 TOTAL                 4         3
Created on 2021-02-09 by the reprex package (v1.0.0)
Hope this helps,
Thanks alot for help, but I have so many columns in my dataframe and i want to give input parameters as data, columns names as variable list, the variable names as header for summary.
for ex myfunc(data=df,var=c(colnames),var_names=c("Tier1_City","Tier2_City")
lars
February 9, 2021, 3:25pm
4
I had some time ago a similar need and came up with the following function. This function also accepts sorting on another output column than the default Total column..
library(tidyverse)

get_tabyl_2 <- function(df = df, by_row = by_row, by_col = by_col, sort_by = Total) {
  library(janitor)

  ## embrace promised arguments
  ## see vignette("programming") section Indirection

  df %>%
    tabyl({{by_row}}, {{by_col}}) %>%
    # adorn_totals(where = c("row", "col")) %>%
    adorn_totals("col") %>%
    adorn_percentages() %>%
    adorn_pct_formatting() %>%
    adorn_ns() %>%arrange(desc({{sort_by}})) %>%
    as_tibble()
}

storms %>% get_tabyl_2(name, status)
#>
#> Attaching package: 'janitor'
#> The following objects are masked from 'package:stats':
#>
#>     chisq.test, fisher.test
#> # A tibble: 198 x 5
#>    name      hurricane  `tropical depression` `tropical storm` Total
#>    <chr>     <chr>      <chr>                 <chr>            <chr>
#>  1 Emily     42.5% (88) 14.5% (30)            43.0% (89)       100.0% (207)
#>  2 Bonnie    38.4% (71) 23.8% (44)            37.8% (70)       100.0% (185)
#>  3 Claudette 15.6% (28) 34.4% (62)            50.0% (90)       100.0% (180)
#>  4 Felix     42.7% (76) 20.8% (37)            36.5% (65)       100.0% (178)
#>  5 Alberto   28.8% (49) 27.6% (47)            43.5% (74)       100.0% (170)
#>  6 Danielle  51.0% (80) 17.2% (27)            31.8% (50)       100.0% (157)
#>  7 Isidore   41.7% (65) 17.9% (28)            40.4% (63)       100.0% (156)
#>  8 Edouard   40.3% (60) 25.5% (38)            34.2% (51)       100.0% (149)
#>  9 Danny     19.2% (28) 34.9% (51)            45.9% (67)       100.0% (146)
#> 10 Ivan      61.8% (89) 14.6% (21)            23.6% (34)       100.0% (144)
#> # ... with 188 more rows
storms %>% get_tabyl_2(by_row = category, by_col = status, sort_by = category)
#> # A tibble: 7 x 5
#>   category hurricane     `tropical depression` `tropical storm` Total
#>   <ord>    <chr>         <chr>                 <chr>            <chr>
#> 1 5        100.0%   (68) 0.0%    (0)           0.0%    (0)      100.0%   (68)
#> 2 4        100.0%  (348) 0.0%    (0)           0.0%    (0)      100.0%  (348)
#> 3 3        100.0%  (363) 0.0%    (0)           0.0%    (0)      100.0%  (363)
#> 4 2        100.0%  (628) 0.0%    (0)           0.0%    (0)      100.0%  (628)
#> 5 1        99.9% (1684)  0.0%    (0)           0.1%    (1)      100.0% (1685)
#> 6 0        0.0%    (0)   0.0%    (0)           100.0% (4373)    100.0% (4373)
#> 7 -1       0.0%    (0)   100.0% (2545)         0.0%    (0)      100.0% (2545)
storms %>% get_tabyl_2(category, status)
#> # A tibble: 7 x 5
#>   category hurricane     `tropical depression` `tropical storm` Total
#>   <ord>    <chr>         <chr>                 <chr>            <chr>
#> 1 0        0.0%    (0)   0.0%    (0)           100.0% (4373)    100.0% (4373)
#> 2 -1       0.0%    (0)   100.0% (2545)         0.0%    (0)      100.0% (2545)
#> 3 1        99.9% (1684)  0.0%    (0)           0.1%    (1)      100.0% (1685)
#> 4 2        100.0%  (628) 0.0%    (0)           0.0%    (0)      100.0%  (628)
#> 5 3        100.0%  (363) 0.0%    (0)           0.0%    (0)      100.0%  (363)
#> 6 4        100.0%  (348) 0.0%    (0)           0.0%    (0)      100.0%  (348)
#> 7 5        100.0%   (68) 0.0%    (0)           0.0%    (0)      100.0%   (68)
mtcars %>% get_tabyl_2(cyl, am, cyl)
#> # A tibble: 3 x 4
#>     cyl `0`        `1`       Total
#>   <dbl> <chr>      <chr>     <chr>
#> 1     8 85.7% (12) 14.3% (2) 100.0% (14)
#> 2     6 57.1%  (4) 42.9% (3) 100.0%  (7)
#> 3     4 27.3%  (3) 72.7% (8) 100.0% (11)
mtcars %>% get_tabyl_2(carb, cyl, carb)
#> # A tibble: 6 x 5
#>    carb `4`       `6`        `8`        Total
#>   <dbl> <chr>     <chr>      <chr>      <chr>
#> 1     8 0.0% (0)  0.0% (0)   100.0% (1) 100.0%  (1)
#> 2     6 0.0% (0)  100.0% (1) 0.0% (0)   100.0%  (1)
#> 3     4 0.0% (0)  40.0% (4)  60.0% (6)  100.0% (10)
#> 4     3 0.0% (0)  0.0% (0)   100.0% (3) 100.0%  (3)
#> 5     2 60.0% (6) 0.0% (0)   40.0% (4)  100.0% (10)
#> 6     1 71.4% (5) 28.6% (2)  0.0% (0)   100.0%  (7)
mtcars %>% get_tabyl_2(gear, cyl)
#> # A tibble: 3 x 5
#>    gear `4`       `6`       `8`        Total
#>   <dbl> <chr>     <chr>     <chr>      <chr>
#> 1     3 6.7% (1)  13.3% (2) 80.0% (12) 100.0% (15)
#> 2     4 66.7% (8) 33.3% (4) 0.0%  (0)  100.0% (12)
#> 3     5 40.0% (2) 20.0% (1) 40.0%  (2) 100.0%  (5)
Created on 2021-02-09 by the reprex package (v1.0.0)
HTH
system
March 2, 2021, 3:25pm
5
This topic was automatically closed 21 days after the last reply. New replies are no longer allowed.
