This snippet mainly works, tho it has many errors. I can't recommend this workflow, however.
.simpleCap <- function(x) {
s <- strsplit(x, " ")[[1]]
paste(toupper(substring(s, 1, 1)), substring(s, 2),
sep = "", collapse = " ")
}
run_tabs <- function(x,y) {
var1 = rlang::parse_expr(y)
expss::var_lab(x[[y]])
table1 = expss::fre(x[[y]],
stat_lab = getOption("expss.fre_stat_lab",
c("Count N", "Valid percent", "Percent", "Responses, %", "Cumulative responses, %")))
}
al <- mtcars
sm <- mtcars[which(mtcars$vs == 1),]
lg <- mtcars[which(mtcars$am == 1),]
pt1 <- run_tabs(al,"gear")
pt2 <- run_tabs(sm,"gear")
pt3 <- run_tabs(lg,"gear")
vs
#> Error in eval(expr, envir, enclos): object 'vs' not found
# check number of rows
pts <- list(pt1,pt2,pt3)
for(i in pts) print(nrow(i))
#> [1] 5
#> [1] 5
#> [1] 4
# fix missing entry for 3-gear case in pt3
which(al$vs == 1 & al$am == 1 & al$gear == 3)
#> integer(0)
padding <- c(3,rep(NA,5))
tmp <- as.data.frame(pt3)
tmp <- rbind(tmp,padding)
tmp <- tmp[c(5,1:4),]
pt3 <- tmp
# rename first column
colnames(pt3)[1] <- "Gears"
# extract common first column
col_one <- pt3[,1]
# convert others to data.frame
pt1 <- as.data.frame(pt1)
colnames(pt1)[1] <- "Gears"
pt2 <- as.data.frame(pt2)
colnames(pt2)[1] <- "Gears"
# collect column names for false header
false_head <- rep(colnames(pt1)[2:6],3)
# create spanning column
spanner <- c("Gears","","Total","","","Small","","","Large","")
# create receiver table
table_body <- cbind(pt1[2:6],pt2[2:6],pt3[2:6])
table_body <- round(table_body,2)
table_body <- cbind(col_one,table_body)
colnames(table_body) <- spanner
# insert false header
finished <- rbind(false_head,table_body)
# remove spurious row numbers
rownames(finished) <- NULL
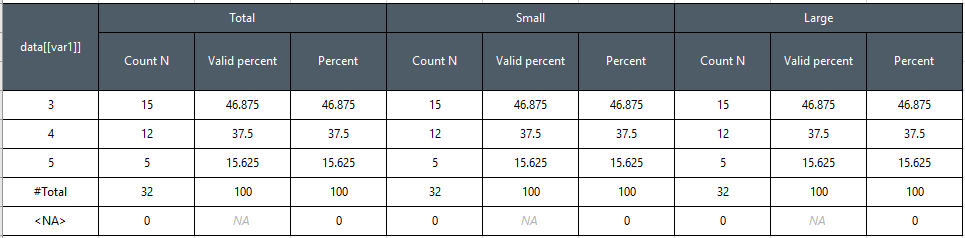
pander::pander(finished)
| Gears |
|
Total |
|
|
| Count N |
Valid percent |
Percent |
Responses, % |
Cumulative responses, % |
| 3 |
15 |
46.88 |
46.88 |
46.88 |
| 4 |
12 |
37.5 |
37.5 |
37.5 |
| 5 |
5 |
15.62 |
15.62 |
15.62 |
| #Total |
32 |
100 |
100 |
100 |
|
0 |
NA |
0 |
NA |
Table continues below
| Small |
|
|
Large |
|
| Count N |
Valid percent |
Percent |
Responses, % |
Cumulative responses, % |
| 46.88 |
3 |
21.43 |
21.43 |
21.43 |
| 84.38 |
10 |
71.43 |
71.43 |
71.43 |
| 100 |
1 |
7.14 |
7.14 |
7.14 |
| NA |
14 |
100 |
100 |
100 |
| NA |
0 |
NA |
0 |
NA |
Table continues below
| NA |
NA |
NA |
NA |
NA |
| Count N |
Valid percent |
Percent |
Responses, % |
Cumulative responses, % |
| 21.43 |
NA |
NA |
NA |
NA |
| 92.86 |
8 |
61.54 |
61.54 |
61.54 |
| 100 |
5 |
38.46 |
38.46 |
38.46 |
| NA |
13 |
100 |
100 |
100 |
| NA |
0 |
NA |
0 |
NA |
Table continues below
| NA |
| Count N |
| NA |
| 61.54 |
| 100 |
| NA |
| NA |
# xlsx::write.xlsx(finished,"finished.xlsx")