Formatting Histograms in R

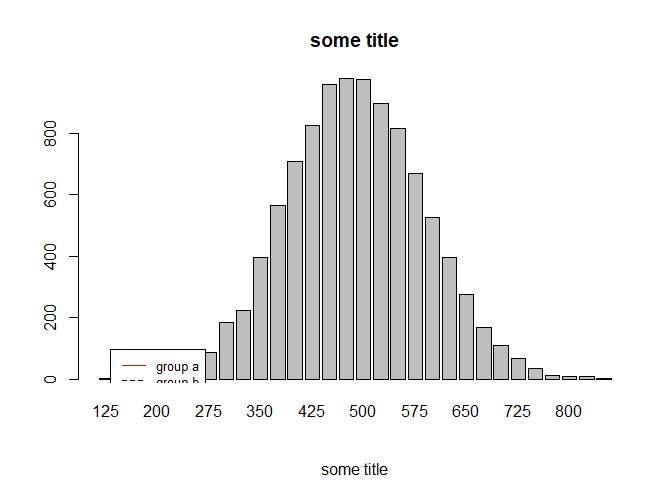
I have the following histogram in R (for some reason, the legend does not work)

      n = floor(rnorm(10000, 500, 100))
     t = table(n)
    
    barplot(t)
    
    legend(1, 95, legend=c("group a", "group b"),
           col=c("red", "black"), lty=1:2, cex=0.8)
    
    title(main = "some title", 
          sub = "some title")

r/rstats - Formatting Histograms in R

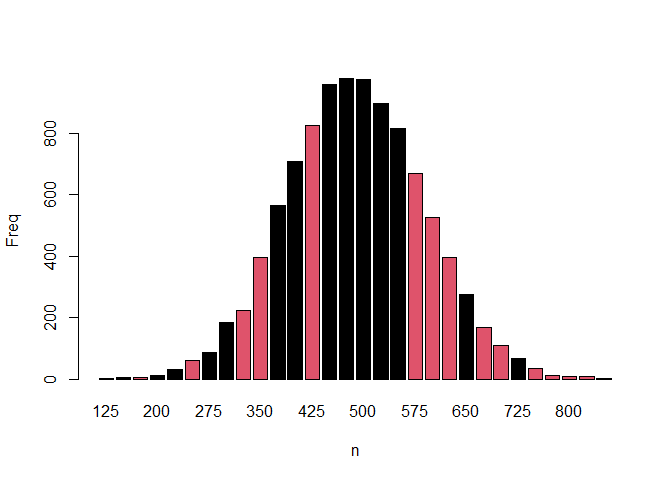
I want to make half of the vertical lines on this histogram "red" :

color <- c("red", "black")     
color_1 <- as.factor(sample(color, 10000, replace=TRUE, prob=c(0.5, 0.5)))
t = data.frame(t)
t$color_1 <-color_1
barplot(t, color = t$color_1)

But this returns several errors:

Error in `$<-.data.frame`(`*tmp*`, color_1, value = c(1L, 1L, 1L, 2L,  : 
  replacement has 10000 rows, data has 574

For some reason, the data has 583 rows instead of the 10,000 originally specified in (where did all the rows go!?)

n = floor(rnorm(10000, 500, 100))

Ignoring this, if I do assume 583 rows:

color <- c("red", "black")     
color_1 <- as.factor(sample(color, 574, replace=TRUE, prob=c(0.5, 0.5)))
t = data.frame(t)
t$color_1 <-color_1
barplot(t, color = t$color_1)

I get a new error:

Error in barplot.default(t, color = t$color_1) : 
  'height' must be a vector or a matrix

Can someone please show me how to fix this error and the legend?

Thanks!

t does not have 10000 rows because it is the output of table(). It has as many rows as there are distinct values in n. If the value 500 appears 40 times in n, t has one entry for 500 with a value of 40.
I modified your code a bit to generate as many values in color_1 as there are rows in t and I decreased the number of bins in n so that it is easier to see the colors.

n = (rnorm(10000, 500, 100)%/%25)*25
t = table(n)

barplot(t)

legend(1, 95, legend=c("group a", "group b"),
       col=c("red", "black"), lty=1:2, cex=0.8)

title(main = "some title", 
      sub = "some title")

color <- c("red", "black")     
color_1 <- as.factor(sample(color, length(t), replace=TRUE, prob=c(0.5, 0.5)))
t = data.frame(t)
t$color_1 <-color_1
barplot(Freq~n, col = t$color_1,data = t)

Created on 2021-10-09 by the reprex package (v2.0.1)

1 Like

thank you! everything looks so nice!

This topic was automatically closed 21 days after the last reply. New replies are no longer allowed.

If you have a query related to it or one of the replies, start a new topic and refer back with a link.