Hello,
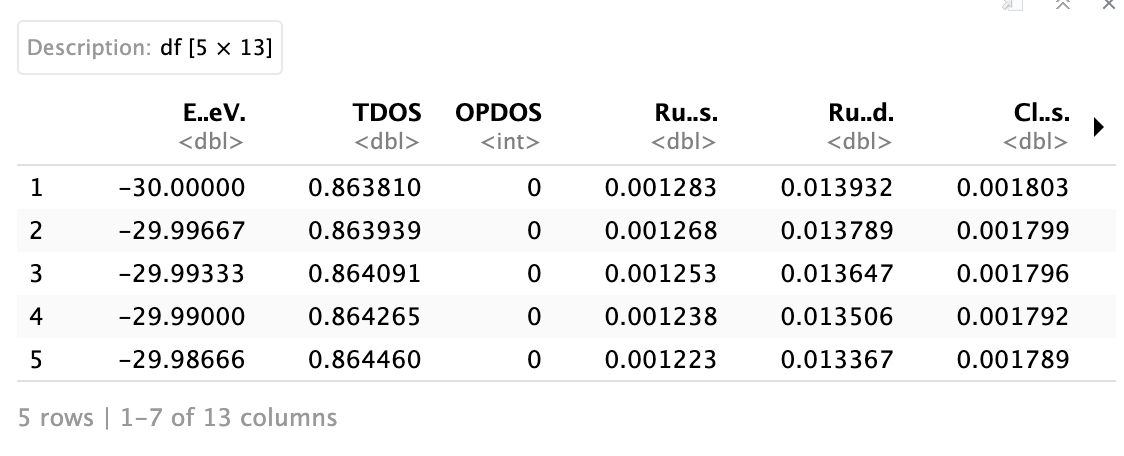
I am trying to generate Density of States plots for some materials that I have data for but I am unsure how to use ggplot2 for this. Here is a picture of how the data is broken up. The x-axis is basically the Energy in eV and each of the other columns corresponds to the grouping of the data. I am trying to get each density plot to overlay onto each of the others but I can't figure out how to do that. All of the examples I have found are for data that also has a category column associated with it but in this case my different categories are the different y-value sets.
Any guidance is appreciated!
This topic was automatically closed 90 days after the last reply. New replies are no longer allowed.
If you have a query related to it or one of the replies, start a new topic and refer back with a link.