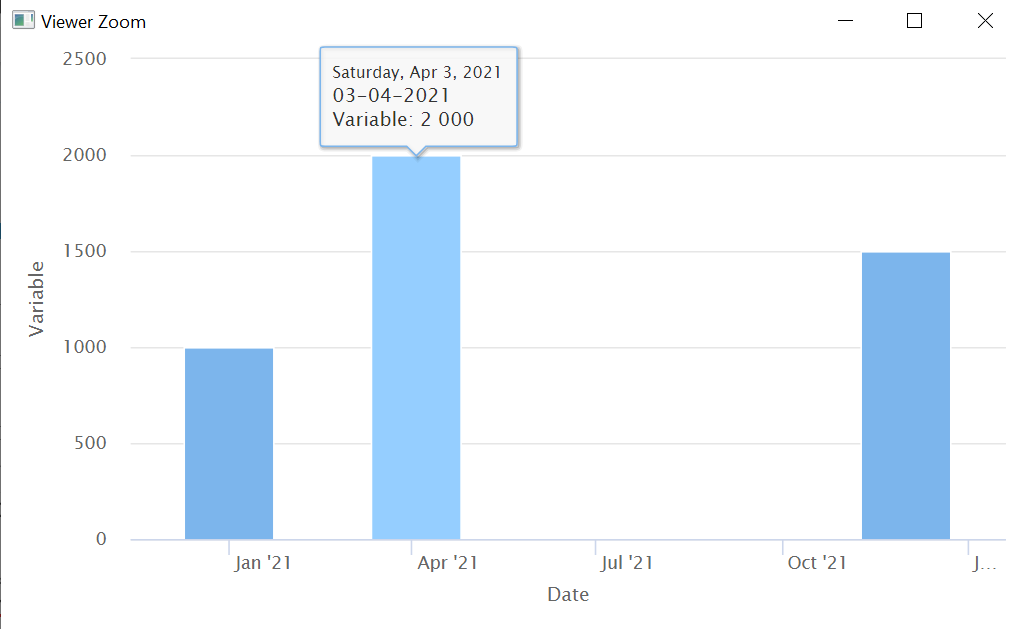
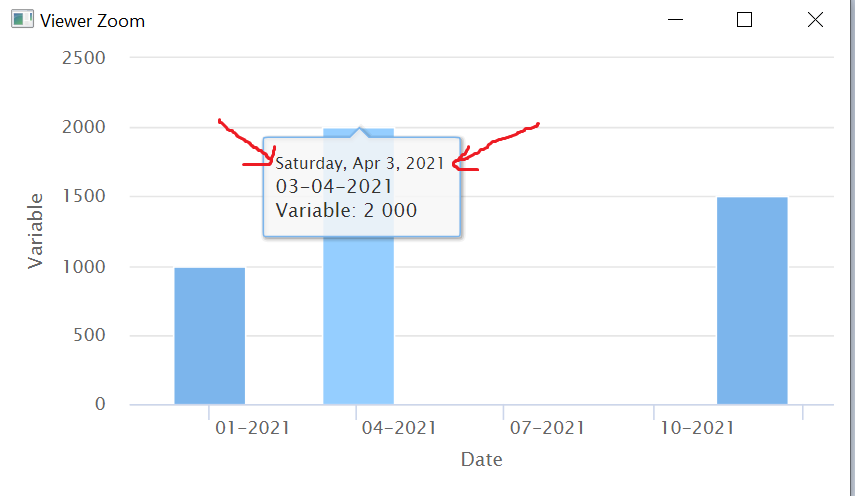
I can't figure out the dates formatting when using the package 'highcharter'. In the chart below, I want the date to be expressed as 03-04-2022 both in the tooltip and on the axis. The tooltip looks ok even though I can't remove the date in whole letters at the top of it and I also can't change the format of the X axis. I would like the X axis expressed with numbers like '01-2021' for January 2021 and not 'Jan' 2021'.
Here is a code example:
library(highcharter)
library(dplyr)

dataset<-data.frame(Date=as.Date(c('01-01-2021','03-04-2021','01-12-2021'),format='%d-%m-%Y'),
                    Variable=c(1000,2000,1500))

plot<-hchart(dataset ,'column',hcaes(x = Date, y = Variable)) %>%
  hc_xAxis(dateTimeLabelFormats = list(day = '%d-%m-%Y')) %>%
  hc_tooltip(pointFormat = "{point.x:%d-%m-%Y} <br> Variable: {point.y}")
For others to help you with this it's best if you can provide a reproducible exampled (reprex). See the following website for the package {reprex} as well as examples of reprex https://reprex.tidyverse.org/.
Thanks, i just edited my question with a reproducible example.
Change your hc_xAxis() call to the following and I believe that will get you what you're looking for. I used R's native pipe to reduce having to load dplyr/magrittr for simplicity.
# packages
library(highcharter)

# data
dataset <- data.frame(
  Date = as.Date(c("01-01-2021","03-04-2021","01-12-2021"),
                 format = "%d-%m-%Y"),
  Variable = c(1000, 2000, 1500)
)


# plot
plot <- hchart(dataset,
               "column",
               hcaes(x = Date, y = Variable)
               ) |>
  hc_xAxis(dateTimeLabelFormats = list(month = "%d-%m-%Y"),
           type = "datetime") |>
  hc_tooltip(pointFormat = "{point.x:%d-%m-%Y} <br> Variable: {point.y}")


plot
Thank you so much, it works perfectly for the X-axis.
Just one last thing, i still have by default the date in whole letters at the top of the tooltip, would you know how to remove it?
See the last argument within hc_tooltip(). I've added xDateformat = " " which removes the date string at the top of the pointer.
# packages
library(highcharter)

# data
dataset <- data.frame(
  Date = as.Date(c("01-01-2021","03-04-2021","01-12-2021"),
                 format = "%d-%m-%Y"),
  Variable = c(1000, 2000, 1500)
)


# plot
plot <- hchart(dataset,
               "column",
               hcaes(x = Date, y = Variable)) |>
  hc_xAxis(dateTimeLabelFormats = list(month = "%d-%m-%Y"),
           type = "datetime") |>
  hc_tooltip(pointFormat = "{point.x:%d-%m-%Y} <br> Variable: {point.y}",
             xDateFormat = " ")


plot
Amazing, all that i needed, thank you very much!