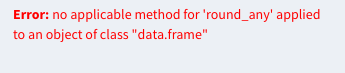
How can i format contents of a value box (unit price and dollar sales) in shiny dashboard in $? The code is as follows without formatting:
Regards,
Chris
#dollarsales
output$dollarsales <- renderValueBox({
data() %>%
filter(transDate >= input$dRange[1] & transDate <= input$dRange[2]) %>%
summarise(Dollarsales = sum(Amount)) %>%
as.integer() %>%
prettyNum(big.mark = ",") %>%
valueBox(subtitle = "Dollar Sales")
})
#Quantitysales
output$quantitysales <- renderValueBox({
data() %>%
filter(transDate >= input$dRange[1] & transDate <= input$dRange[2]) %>%
summarise(Quantitysales = sum(Quantity)) %>%
as.integer() %>%
prettyNum(big.mark = ",") %>%
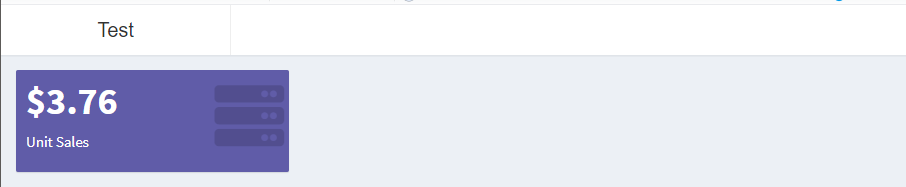
valueBox(subtitle = "Unit Sales")
})
#Averageunitprice
output$averageprice <- renderValueBox({
data() %>%
filter(transDate >= input$dRange[1] & transDate <= input$dRange[2]) %>%
summarise(Averageprice = mean(UnitPrice)) %>%
prettyNum(big.mark = ",", digits =4) %>%
valueBox(subtitle = "Average Unit Price")
})
Created on 2019-07-18 by the reprex package (v0.3.0)