Hey all,
I have the following code.
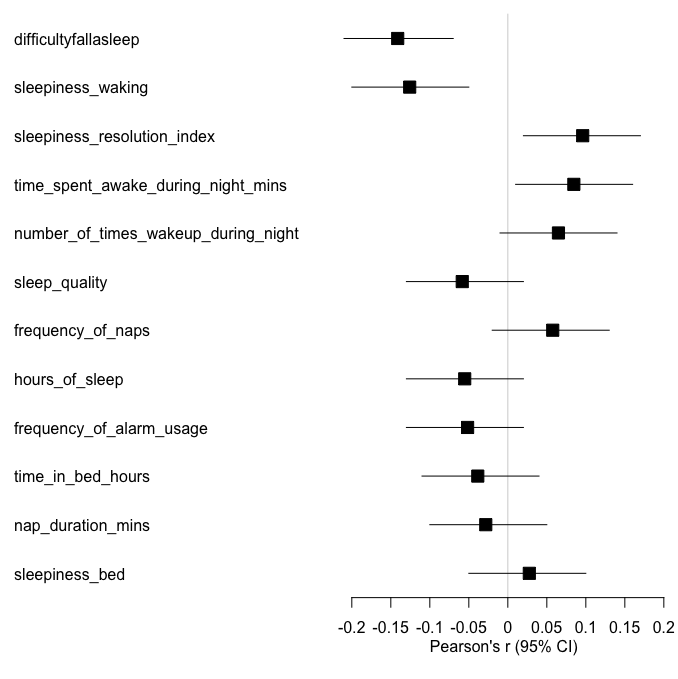
I am plotting a forest plot and would like to change the distance between the x-axis labels and the x-axis tick marks (photo attached of the current plot).
I would be so grateful for a helping hand as I have not been able to find a way to do this!
forestplot(labeltext = correcteddfforest$`variable of interest`,
           mean = correcteddfforest$correlation, upper = correcteddfforest$CIsupper,
           lower = correcteddfforest$CIslower,
           xlab = "Pearson's r (95% CI)",xticks = c(-0.2,-0.15,-0.1,-0.05,0,0.05,0.1,0.15,0.2), txt_gp = fpTxtGp(xlab = gpar(cex=1),ticks=gpar(cex=1)),
           col = fpColors(lines="black", box="black"),
           hrzl_lines= TRUE,
           graphwidth = "auto")